

Understanding Criticality of Thermal Performance in Thermal Interface Material Applications
Effects of types of TIM types, thicknesses and contact pressure in a real-world application.
Power electronics are integral parts of power components, power supplies, 5G networks, automotive and defense/space applications. All modern power electronics have two critical factors in common that drives the need for unprecedented thermal management: first, increased transistor density to meet the higher demand in increased computing power and second, component miniaturization leading to higher heat flux. It is well known in the electronics reliability field that 55% of the component failures in electronics devices are related to excess heat. The Arrhenius equation in Eq. 11 predicts that, for electronics, the lift of the device decreases by half2 by increasing the device temperature by 10°C. Design engineers mitigate this issue by carefully selecting thermal interface materials (TIM) to keep the system/device temperature at the desired level.
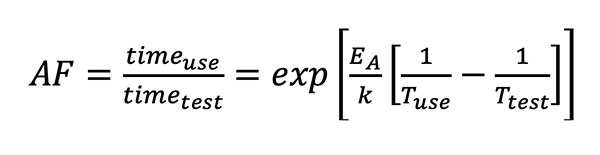
EQ. 1
AF = Acceleration factor
T = Temperature
EA = Activation energy
K = Boltzmann constant
The primary function of a TIM is to replace the air between the heat-generating component and the heat spreader/heatsink to improve heat dissipation. FIGURE 1 shows an illustration of a typical microelectronics packaging assembly with heatsink and TIM. Unevenness and roughness of the surface must be taken into consideration when implementing a thermal solution.
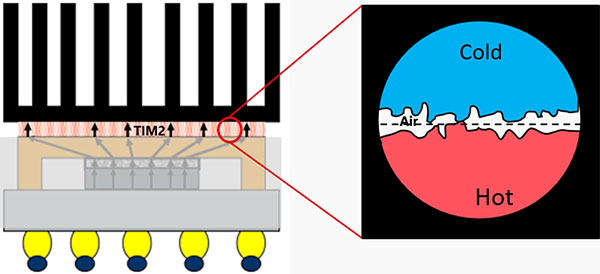
Figure 1. Illustration of rough interfaces.
For the heat to be adequately dissipated, it must reach the heatsink surface first. Efficiency of heat transfer from the hot device to the cold heatsink depends on effective thermal resistance of the bulk TIM and contact resistance at both surfaces.
Definitions
Thermal conductivity. Thermal conductivity (TC), designated as k, is the bulk property of a material that indicates its ability to conduct heat. It does not depend on the geometry or interfacial conditions of the test set up. Fourier's law of thermal conduction provides us a way to calculate k using the equation in Eq. 2.
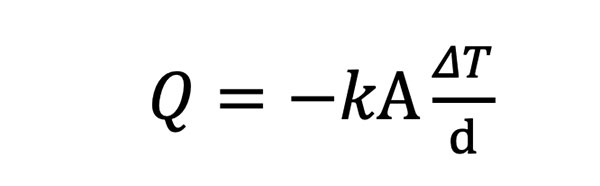
Eq. 2
Q = Heat flux (W)
k = Thermal conductivity (W/m-K)
A = Area (m2)
d = Thickness (m)
FIGURE 2 is the graphical representation of Fourier's equation.
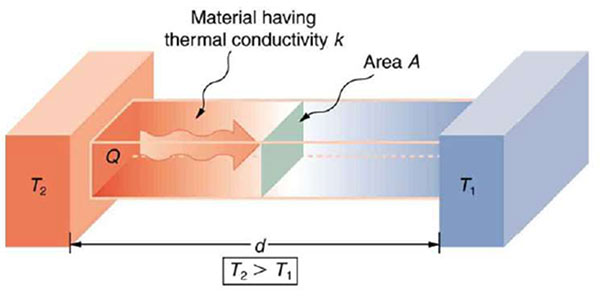
Figure 2. Fourier's law representation.
The term "thermal conductivity" applies to homogeneous materials only. Thermal interface materials, however, are not homogeneous. They are considered heterogeneous materials. Hence the proper terminology to describe the conductivity of TIM is "effective or apparent thermal conductivity." Effective thermal conductivity is calculated by Eq. 3.
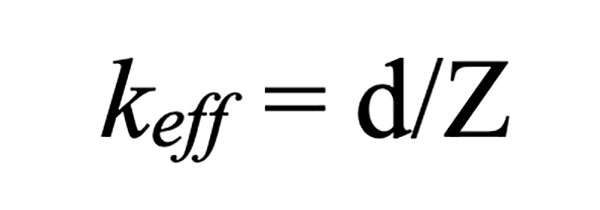
Eq. 3
keff = Effective thermal conductivity, W/m-K
Z = Thermal impedance, °C-m2/W
Thermal resistance. Thermal resistance (TR) can be thought of as the opposite of thermal conductance. For a steady state conduction as shown in Figure 2, the Fourier's equation for thermal resistance can be written as Eq. 4.
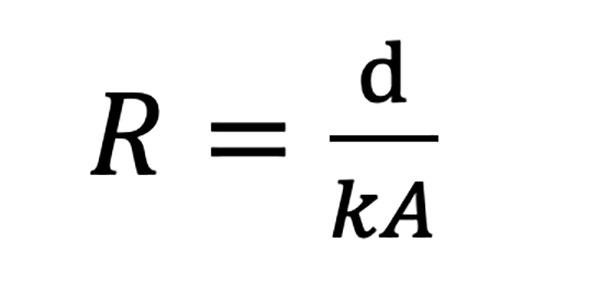
Eq. 4
R = Thermal resistance, °C/W
Thermal impedance. Thermal impedance (TI) is similar to thermal resistance, and they are often used interchangeably. There is a distinct difference between thermal resistance and impedance, however. TI is defined as the temperature gradient per unit of heat flux, passing through the interface. As shown in Eq. 5, TI is obtained by simply multiplying the resistance, R, by the area over which the heat is dissipated.
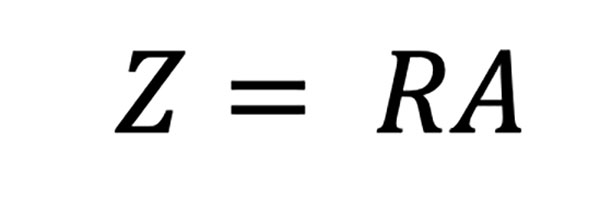
Eq. 5
TI includes bulk thermal resistance of the TIM and contact resistance between the TIM and the two surfaces in contact with the TIM. As the thermal resistance is directly proportional (Eq. 3) to the TIM thickness, the thinner the TIM thickness, the lower the thermal resistance. Contact resistance on the other hand depends on the two contacting surface conditions and the ability of the TIM to fill in the surface roughness (Figure 1). Surface roughness and unevenness can trap air (air is a thermal insulator) reducing the effectiveness of TIM to transfer heat. FIGURE 3 is a graphical representation of the resistance in series across the component and heatsink assembly. Total resistance is the sum of all three resistances (impedance).
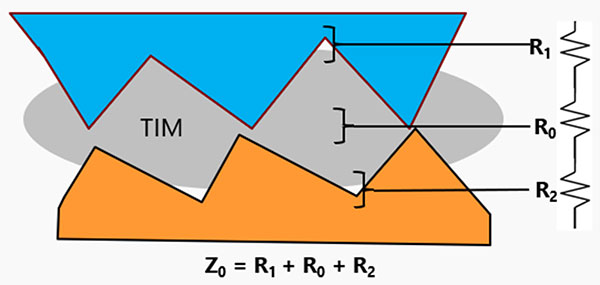
Figure 3. Thermal impedance explanation.
Thermal Performance Characterization
Thermal performance characterization of TIM is critical in selecting the right TIM for an application. Characterization can be challenging, however, as many industry standards are in use. Examples of such standards are ASTM D5470, JESD51:1-14, SEMI 750, and SEMI G68-96, to name just a few. In addition, these standards could have many test methods/variations. Using a standardized test method is imperative to enable the end-user to compare TIM products from different suppliers.
Two common types of testing are performed at the material level (TIM characterization). They are steady state and transient testing. The most common steady state testing equipment is based on the ASTM D5470 standard and transient testing is based on the ASTM E1461 Laser Flash method. This study used the ASTM D5470 test method (Steady State Thermal Testing-ASTM D5470-63) to characterize all TIMs in testing.
A typical ASTM D5470 test setup to obtain effective thermal conductivity is shown in FIGURE 4. Thermocouples (TC) are embedded on the surface of the hot and cold bar to measure the exact temperature of both surfaces. This setup assumes the following once steady state is reached:
- Temperature gradient is uniform across the column
- All power applied goes through the column only
- Heat flow is one-dimensional
- No interfacial resistance (negligible amount) between the cold and hot bars
- Both surfaces are flat and level.
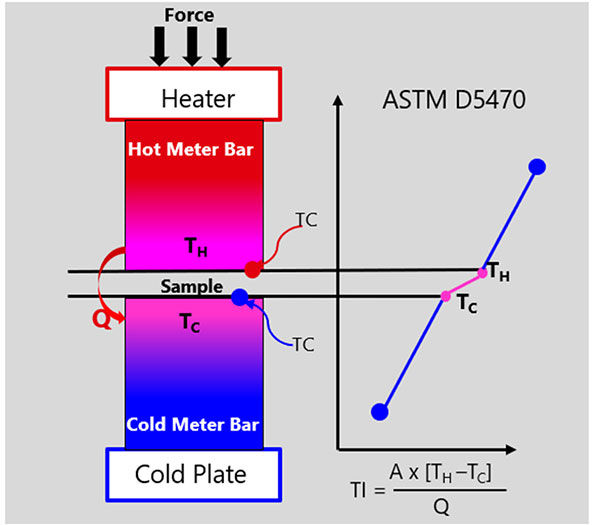
Figure 4. Schematic of steady state thermal test method.
When the sample is placed between the two bars, it poses some resistance to the flow of heat. Based on the measured temperatures and known thickness, a TI can be calculated.
Effective thermal conductivity can be calculated from measured thermal impedance and measured sample thickness provided contact resistance << sample resistance (typically less than 1% of sample resistance).
Experimental Study
As described earlier, thermal performance of a TIM depends on the thermal conductivity, TIM thickness, area, and contact resistance at both interfaces. Contact resistance, on the other hand, depends on the TIM's ability to wet out (fill in the microscopic surface imperfection that could trap air) the mating surfaces. Better wet out can be achieved by various means. Examples are smoother surfaces, TIM's wetting ability (liquid versus pad), and increased pressure for better contact. This experimental study explored the effects of types of TIM (pad versus gel), TIM thickness and contact pressure as phase 1 of this study.
Experimental setup. The first part of the above hypothesis was tested by conducting a 2K design of experiment (DoE) as shown in TABLE 1. A gap pad and gel were selected for this study with listed thermal conductivity of ~5W/m-K. The second part of the study (Ladder Study) used various pad thicknesses and assembly (test) pressure to observe its effect on thermal impedance. The sample used for this study was an ultra-low modulus gap pad with TC of ~6W/m-K. TABLE 2 shows the experimental matrix.
Table 1. 2K DOE Table
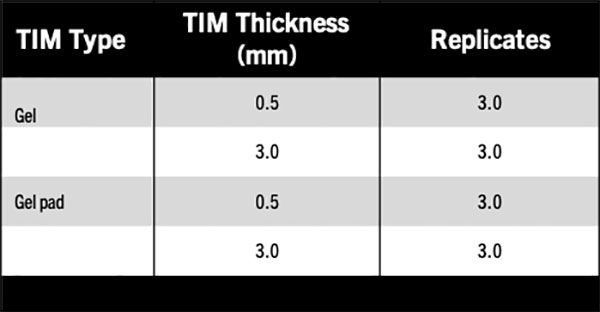
Table 2. Ladder Study for Effect of Contact Pressure
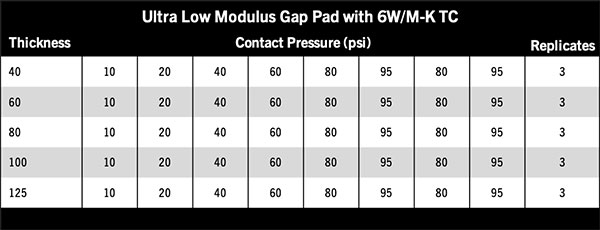
FIGURE 5 shows the equipment used in this study. Gap pad samples were cut to a diameter of 33mm (1.3″). Liquid samples are applied to the tester with a measured volume to achieve desired thickness with a diameter of 33mm (FIGURE 6). The TIM tester has a built-in thickness measurement system that accurately measures and records the thickness of each sample.
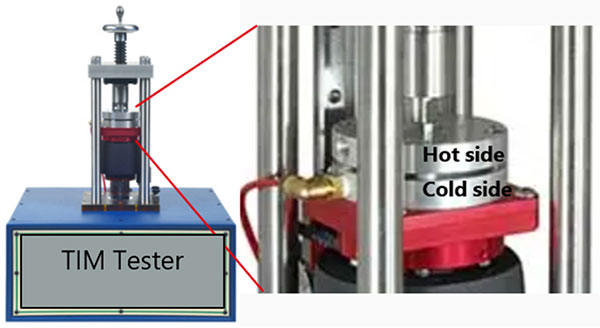
Figure 5. Test equipment.
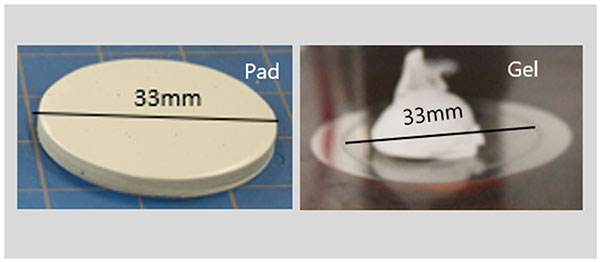
Figure 6. Test specimen examples.
Predictions. As a gel is a liquid TIM, it should provide better wet out of the surfaces leading to lower thermal resistance as compared to a pad. The same theory should be applicable to thinner TIM thickness as described in section II. By increasing the assembly pressure for a pad, we should also observe better wet out.
Results and Analysis
Thermal impedance analysis. As predicted, DoE analysis for TI shows that regardless of product type, TIM thickness has the largest impact on the TI: The thinner the TIM thickness, the lower (better) the TI. Product type analysis also agrees with the prediction that gel (which is a liquid) wets out the interface better, leading to lower TI.
FIGURE 7 shows the main effect plot and ANOVA analysis as obtained from MiniTab analysis. A P-Value of 0.0 for all main effects and interaction indicates statistical significance of product type and TIM thickness.
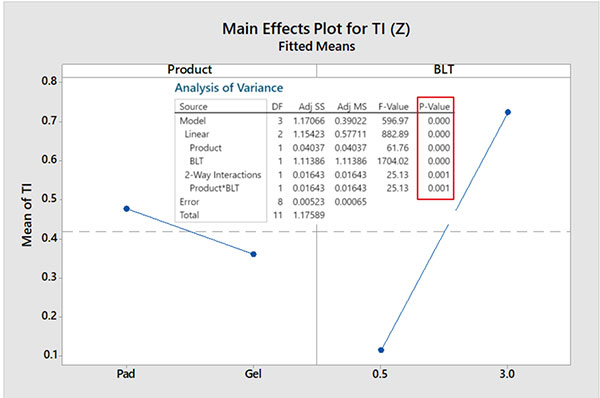
Figure 7. DoE analysis for thermal impedance.
Effective thermal conductivity analysis. Effective TC was calculated using Eq. 3 with the measured TIM thickness as described earlier. Effective TC depends not only on the bulk TC of the sample but also on the contact resistance. The trends observed in effective TC are similar to TI, as predicted by the hypothesis. The result from the MiniTab analysis is presented in FIGURE 8.
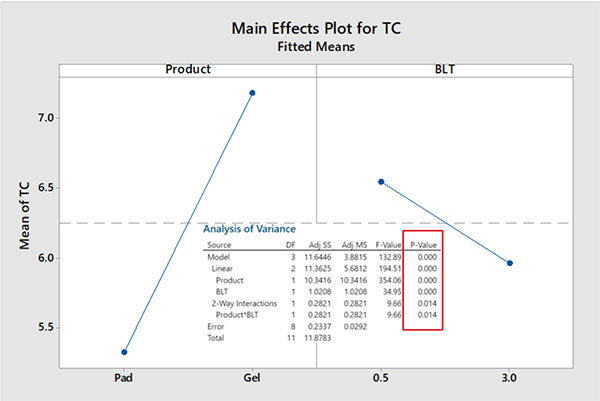
Figure 8. DoE analysis for effective TC.
Assembly (test) pressure effect. Assembly pressure effect test was conducted using the same test setup as shown in Figure 4. A typical sample condition before and after testing is shown in FIGURE 9 for a 125-mils thick sample. As expected, at higher pressure, the sample becomes much thinner and squeezes out to the outside perimeter of the test fixture.
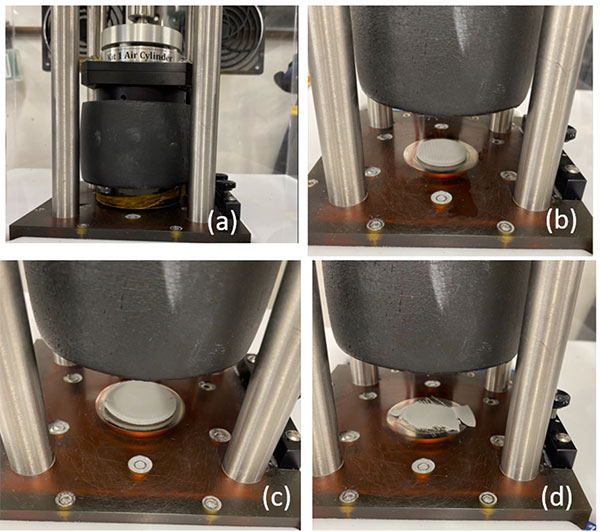
Figure 9. Effect of pressure on sample condition: a) image of test setup, b) sample prior to testing, c) sample after 40psi testing, (d) sample after 95psi testing.
FIGURE 10 shows the results from the ladder study as described in Table 2. As predicted, there is a clear trend in improved thermal performance (lower TI) with increased pressure regardless of initial sample thickness. This is the result of better wet out and thinner bond line with increased test pressure.
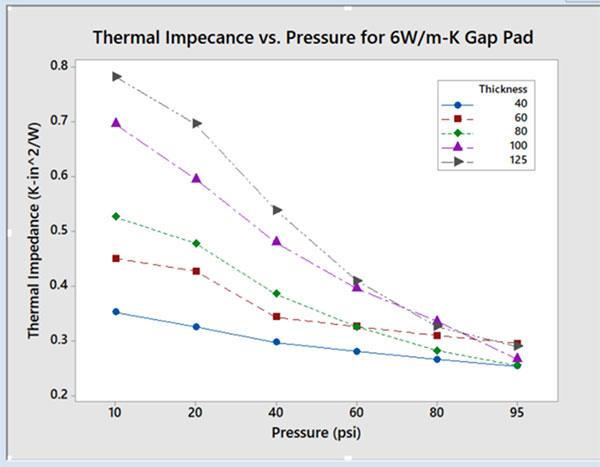
Figure 10. Effect of pressure on thermal impedance.
Summary and Conclusion
The primary objective of this study was to provide the end-user of thermal interface materials a means to select, evaluate and implement a thermal solution for their applications above and beyond the review of a published technical data sheet (TDS). The traditional approach of focusing on the TC of a TIM is no longer sufficient to meet today's stringent requirements of high-performing electronics. A better approach is to evaluate the thermal performance of a TIM – taking into account bulk thermal conductivity, the TIM's ability to wet out the contact surfaces and bond line thickness.
Results from this study clearly demonstrate the bond line thickness effect on the overall thermal performance. Figures 6 and 7 show that regardless of the TIM type, pad or gel, thinner bond line provides lower impedance and higher effective thermal conductivity.
This study further demonstrates that by mechanically pushing the air out of the interface, thermal performance can be improved. The practical aspect of this strategy must be considered, however. Most gap pads cannot be compressed more than 40-50% of the original thickness. This is demonstrated in Figure 8 where excess force destroys the sample. This will create high risk in real applications.
Acknowledgments
I would like to express my sincere gratitude to David Franco, Peter Jones and John Prindl from Henkel for conducting all laboratory tests and providing insight to the test equipment and methods. Without their support, this work would not have been possible.
References
-
Amir Rubin, "Life Expectance of Electronic Equipment Post-loss," AREPA, https://www.arepa.com/media/zi2lbdvf/arepa-whitepaper-extending-life-expectancy.pdf.
-
Wikipedia, "Arrhenius Equation," retrieved Dec. 26, 2021, https://en.wikipedia.org/wiki/Arrhenius_equation.
-
ASTM, "Standard Test Method for Thermal Transmission Properties Of Thermally Conductive Electrical Insulation Materials," Nov. 15, 2017, https://www.astm.org/d5470-17.html.
Ed.: This article is an update of work originally published at IMAPS 2022.
is director, technical service engineering at Henkel Corp.(henkel.com); rita.mohanty@henkel.com.


Press Releases
- XLR8 EMS Welcomes Raul Jorge Lopez Jr. as Director of Program Management and Procurement
- Koh Young America Promotes Ramiro Mora to Lead Service and Applications in Mexico and South America
- ViTrox Americas Welcomes Huy Pham as Technical Support Engineer
- XLR8 EMS Appoints Steve Dutton as Chief Sales Officer