

Robustness of High Tension, Standard Tension and Mesh Mount Solder Paste Stencils
An examination of volumetric transfer efficiencies at different aperture locations.
The fishbone diagram associated with stencil printing contains a staggering number of variables, the interdependence of which contributes to the high probability of defect origination.1 Stencil tension is one of the variables and, surprisingly, has not received much attention. This work illustrates the significant influence – particularly with miniaturized, fine-pitch components – that stencil tension has on next-generation PCB assembly results.
This study evaluated the effectiveness of mesh mount, standard clamping tension, and high clamping tension stencils under different parameters, including print quantity and squeegee blades (new/old) by comparing the volumetric efficiencies at the most wear susceptible locations identified on the stencil. The robustness of the stencil is also determined by analyzing the foil for any potential damage at sensitive locations, which includes the components (BGAs and passive devices) within shield enclosure boundaries for printing defects at intervals of 0 (“as received”), 5,000, 10,000, 15,000, and 20,000 print cycles, respectively. Statistical approaches were used to determine how stencil tension influences volumetric efficiencies and which stencil tension provides a more repeatable print. Designing stencil apertures to industry-acceptable area ratios is also of great importance to ensure all the printed solder paste material is deposited on the substrate.2 These sets of experiments illustrate the effectiveness of stencil tension and provide insight on printing improvements that keep pace with miniaturization of electronic products.
Materials and Test Equipment
Stencil frames. The following stencil frame types were used for analyzing the effectiveness of the stencil tension on the print process:
- Standard clamping tension master frame, direct foil (mesh-less) attachment to 23" square VectorGuard frame (32N/cm est. tension).
- High clamping tension master frame, direct foil (mesh-less) attachment to 23" square VectorGuard frame (47N/cm est. tension).
- Standard mesh mount stencil, permanent glue bonded foil (standard tension) attached to 23" square tubular aluminum frame (35N/cm est. tension).
Types 1 and 2 provide mechanical foil attachment using external air pressure to engage and disengage spring clamps positioned along the frame perimeter. These clamps are designed to secure the foil with uniform tension.3
Test vehicle. A single-sided printed circuit containing two different shield perimeter pad designs with BGAs and passive devices both inside and outside their boundaries was used for the study. The dimensions of the board measure 150mm x 100mm x 1mm, as shown in FIGURE 1.
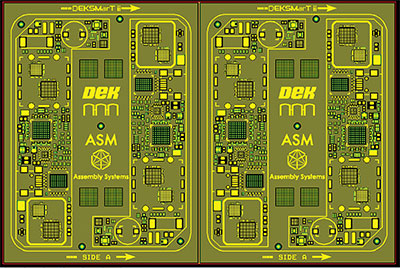
Figure 1. Test vehicle PCB with BGAs, passive devices, and shields.
The area of interest for print study analysis is indicated by the dashed red line in Figure 1 and FIGURE 2. A total of 10 PCB assemblies were used for printing solder paste and analyzing the volumetric efficiencies from a solder paste inspection (SPI) machine.
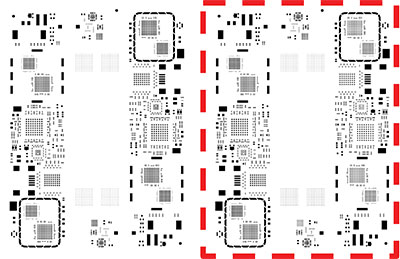
Figure 2. Aperture layout of stencil foil.
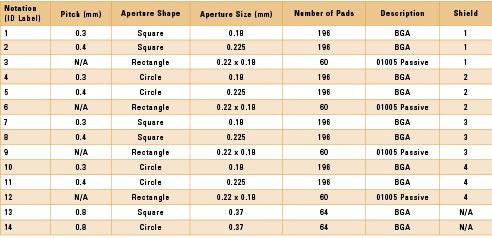
Solder paste. The solder paste used for this study was a Type 5, lead-free Indium 8.9HFA with an alloy composition of 96.5Sn3Ag0.5Cu and metal content of 88.25%. Type 5 material was selected due to its particle size and print compatibility with miniature components (TABLE 1). This particle size solder paste delivers better transfer efficiency and augments printing for miniaturized components such as wafer-scale ultra-fine-pitch array components and sub-01005 passives, which are part of the test board design.
Table 1. Component Designations
Stencil foil. The stencil foil material was standard stainless steel, with apertures formed via laser cutting. All three stencils were laser-cut in sequence by the same laser tool to ensure minimal differences in quality. Laser-cut technology was chosen due to its broad adoption in the stencil manufacturing process. The stencil foil was 2.4 mils (60µm) thick (Figure 2). The reason for using such a thin stencil foil material was twofold: First, the miniaturized components on the test board design are such that an ultra-thin foil is required to maintain a compatible printing area ratio throughout. Second, the thinner foil degrades more quickly during printing due to coining under repeated stencil wiping, and this acceleration was beneficial for the timeline of this evaluation.
In this study, one stencil foil was used for each frame type, three foils in total. The apertures between the stencils were geometrically identical, created from the same stencil Gerber file and processed on the same laser-cutting tool. A removable coupon with test apertures was produced on the foils to verify stencil aperture size accuracy and repeatability. A size tolerance range of ±0.005mm was given to the stencil manufacturer to ensure aperture uniformity was achieved.
Squeegees. A metal squeegee material, which is the industry norm, was selected for this experiment, as it produces consistent solder volumes and is resistant to scooping the solder paste out of the apertures during printing. The spring metal steel blade was 7.8 mils (0.2mm) thick. This study required a total of eight squeegee blade pairs. The printing of 10 boards required use of both the forward and reverse squeegee on the stencil printer. Hence, the mesh mount frame was the first stencil which required two squeegees to conduct the print test on 10 PCBs, as well as continuous printing until achieving 20,000 cycles. These squeegees were then replaced post-20,000 print cycles with new blades and another 10-print test conducted. This methodology allowed investigation of the print quality of a worn stencil using worn squeegees, as well as comparison to new squeegees on the worn stencil. The new set of squeegees used for the worn mesh mount stencil was then used for printing a new standard clamping tension VectorGuard stencil. This experiment routine was repeated with the high clamping tension VectorGuard stencil.
Test equipment and inspection. The SMT assembly equipment used for this test included an ASM DEK Horizon 01iX stencil printer and a Koh Young 3030VAL SPI. A Keyence VHX-6000 digital microscope was used to visually inspect paste deposits for shield perimeter pads, BGAs, and passive devices. FIGURES 3a and 3b show numbered locations (in blue), which indicate the sites measured by the SPI. Shield 1 BGA aperture designs are squares, while Shield 2 BGAs are circles. The Shield 2 pattern is orientated 180° relative to Shield 1. All other design features of the two shields are the same.
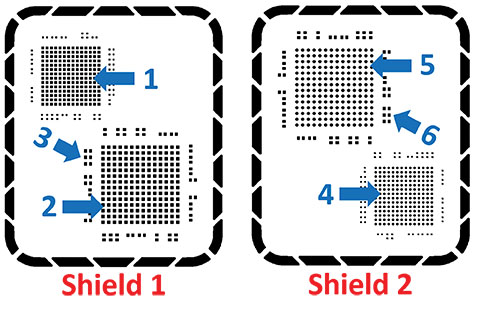
Figure 3a. Stencil detail of wear-sensitive apertures in the “high aperture density” shield enclosed areas.
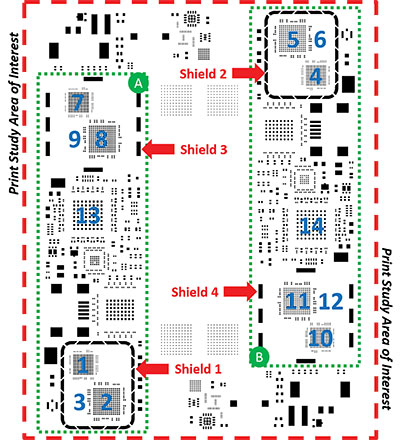
Figure 3b. Full stencil detail of solder paste inspection and optical microscopy template.
Similarly, all BGAs within Region A (Figure 3b) are square apertures, and BGAs within the Region B are circular apertures. Shields 3 and 4 have a different perimeter pad design compared to Shields 1 and 2, requiring fewer apertures and spaced farther apart (i.e., low aperture density shield apertures). Data presented later in this paper illustrate that print results on devices contained inside the two unique shield perimeter design apertures are influenced differently as stencils are worn. Table 1 shows the detailed list of component descriptions and aperture designs used for quantitative and qualitative analysis.
Test Sequence
The test approach for the given PCB assembly was as follows:
- Assess the capability of SPI by conducting a gage repeatability study with and without bare board teach (BBT) option.
- The high flatness quality of PCBs used did not require use of BBT in SPI to produce highly repeatable results.
- A printed reference board was used to verify the accuracy of the SPI and was preserved and maintained throughout the project.
- PCBs were numbered to retain the same run order for all 10-print run quality tests, each one measured by SPI. The tenth board was also manually examined under a digital microscope, and designated locations were photographed.
- New squeegee blades were used for initial 10-print run quality testing on each of the three “as received” condition stencils. Endurance printing to wear stencils was performed until accumulating 5,000 wipes, followed by another 10-print run quality test. Intervals of 5,000 wipe endurance printing and 10-print run quality tests continued (using the same squeegee blades) until endurance printing achieved 20,000 wipes. Note: The print parameter differences between “quality tests” and “endurance printing” are explained in TABLE 2. The final print quality test for each print-fatigued stencil was performed after replacing the worn squeegees with new blades.
Table 2. Parameters for Experimental Study
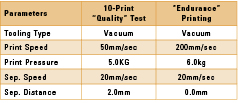
Stencil Printing Parameters
Key printing machine operating parameters are listed in Table 2 and include squeegee speed, squeegee pressure, separation speed and separation distance. These settings were chosen with consideration to the delicate, thin foil to accommodate SMT production tempo, while suited to the testing purpose.
Observations and Discussion
In the early stages of print cycling, all stencils produced similar quality printing results, but there was a point at which the accumulated cycles from endurance printing started to degrade print quality across the stencils at unequal rates. The mesh mount stencil was first to reveal highly visible indications of surface wear. The regions on the foil surrounding Shield 1 and 2 (the high aperture density shields) were specifically impacted by recurring squeegee contact, becoming marred with prominent witness lines. These two regions also exhibited tension loss occurring within the shield perimeter apertures. Attempts were made to characterize tension over time using a dial indicator to record local foil deflection under a range of controlled applied weights, but the poor measurement repeatability from the crude apparatus proved impossible for proper trend interpretation. However, the print quality results measured by SPI in the Shield 1 and 2 regions correlated well with the perceived deteriorating tension. SPI data showed elevated levels of print volume data scatter, which is reflected in boxplot and standard deviation data graphs referenced later in this article.
What is believed to have occurred sooner on the mesh mount stencil compared to the other two stencils is the foil tension translating through the narrow web interspaces between the large perimeter shield apertures (for Shields 1 and 2) was not high enough to counteract a natural curling response of the foil. This curling behavior develops from the accumulation of abrasion stress caused by the squeegee, much like a ribbon would behave when slid across a sharp blade. The stencil foil overcomes this tendency to curl, as long as there is enough outward applied tension to maintain its straightness. When the applied tension is insufficient to continue holding the foil level, it may deviate from planarity and succumb to the unremitting curl stress condition. The consequences of this are believed to impact both aperture filling and release processes, setting up unfavorable print control conditions that ultimately degrade the opportunity to produce uniform prints.
Shield 1 region analysis. The impact of stencil wear on print quality is illustrated by the progression of print defects observed across the various print quality tests taken at milestone print cycles. Component ID 1 located inside Shield 1 serves as an excellent example for this, as referenced in FIGURE 4, where photos of this printed BGA site are shown after the tenth consecutive print using the mesh mount stencil. Neither this stencil nor the two other stencils were cleaned between print strokes (during the “quality” test) in order to witness and compare natural process degradation. Note that all stencils were thoroughly cleaned at endurance printing milestone print cycles. The 10,000-cycle print quality test marked the first occurrence where any visible paste bridging defects were seen, labeled by the red dashed outlines in Figure 4. The 15,000 and 20,000 cycle print quality tests showed expanded regions of paste bridging. FIGURE 5 shows a detailed view of the 15,000-cycle print quality test, where it is apparent that bridging defects are even more widely occurring. Missing from these images is the 20,000-cycle print quality test result after replacing worn squeegee blades with new blades. It was consistently observed with all stencils tested that the installation of new squeegee blades after 20,000 print cycle “endurance” printing did not typically improve print quality to overcome any previous occurring defects.
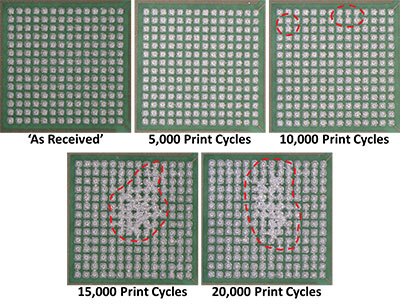
Figure 4. Print quality results using mesh mount stencil for BGA component ID 1.
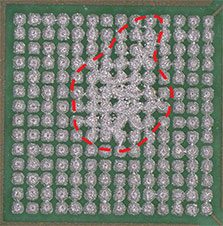
Figure 5. Detail of BGA component ID 1 print quality results after 15,000 print cycles.
Data analysis. Solder paste inspection volumetric data were recorded for each print in the group of ten boards run in the quality test after milestone endurance cycles at time 0 (as received), 5,000, 10,000, 15,000, 20,000, and 20,000 with new squeegee blades for all three stencils under their different tensions. Graphical trend analysis of box and whisker plots means interval and standard deviation distributions provided the essential details for evaluating the print quality behavior over the course of experiments.
Statistical Analysis
Box and whisker plot analysis. The presence of high solder paste volume transfer outliers was the main SPI recorded defect, which correlated to the observations of solder bridging previously shown. The box and whisker plot in FIGURE 6 offers a clear indication that mesh mount and standard clamping tension stencils have higher variances, whereas the high clamping tension stencil has better stability with printing performance, exhibiting almost constant mean throughout the process. A controlled mean paste transfer efficiency of nearly 100% is an excellent outcome and was achieved by all stencils in early stages of wear testing, but from 10,000 print cycles onward, the stencil types began to show deviating results. An outlier transfer efficiency percentage of more than 150% indicates an excessive amount of paste volume, signaling the process is escalating out of control, and intervention is required to restore optimal paste transfer efficiencies.
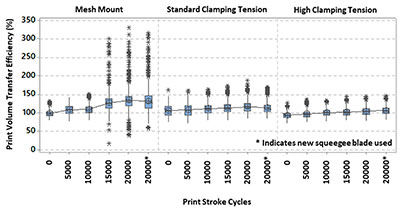
Figure 6. Boxplot results of all 10 print run quality tests for all stencil frame types at BGA component ID 1.
Interval plots. Continuing the discussion focus on BGA component ID 1, the interval plot in FIGURE 7 provides an overview of the cumulative mean volume paste transfer at different stages of printing the stencils through this course of study. Higher mean paste transfer generally correlated to higher standard deviation (i.e., more print volume scatter), but results of the high clamping tension stencil were the closest to maintaining the ideal 100% paste transfer across all the printing cycles compared to the other frames.
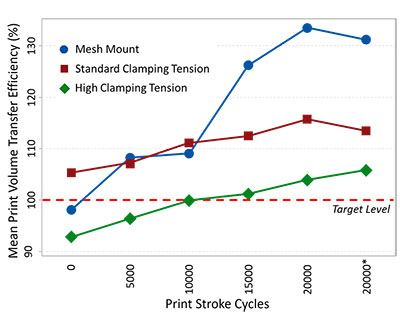
Figure 7. Interval plot for BGA component ID 1.
Standard deviations. Surveying the print volume data by computed standard deviations provides a quick and convenient method to perform process control comparisons. The measure of producing highly uniform print deposits is characterized by achieving the lowest standard deviation values. The next several figures compare print results by standard deviation analysis calculated from all print deposits in a device type combined across the 10-print quality test. This grouping of print volume transfer efficiencies is the source data from which a standard deviation is derived. The standard deviations were analyzed and compared for all the components specified in Table 1. FIGURES 8 to 14 present this series of standard deviation trend graphs, tracking print uniformity results from quality tests for the three stencil types across the full test range of endurance print stroke cycles. The graphs are identically formatted and separately organized for pairwise component-level comparison. It is typically accepted and applied here that a standard deviation value of 10% denotes the pass/fail process control threshold (indicated by the dashed red line in these figures).4 The strongest observations concerning the influence of the stencil tension variable from a collective viewpoint of all these figures can be summarized as follows:
1. Stencil tension is found to have the largest influence on print uniformity for the components located within the two high aperture density shield areas (i.e., Shields 1 and 2). The print quality benefit of using high foil tension is clear.
2. In the printed regions of the board outside of Shields 1 and 2, the benefit of high tension on print control is either less significant or has no clear impact.
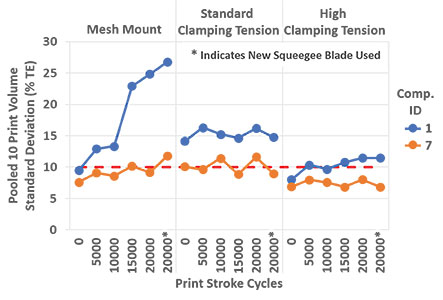
Figure 8. Standard deviations of 0.3mm pitch BGAs, square apertures, component ID 1 (Shield 1) vs. component ID 7 (Shield 3).
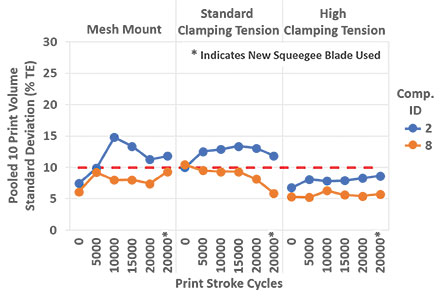
Figure 9. Standard deviations of 0.4mm pitch BGAs, square apertures, component ID 2 (Shield 1) vs. component ID 8 (Shield 3).

Figure 10. Standard deviations of 01005 passive devices, component ID 3 (Shield 1) vs. component ID 9 (Shield 3).
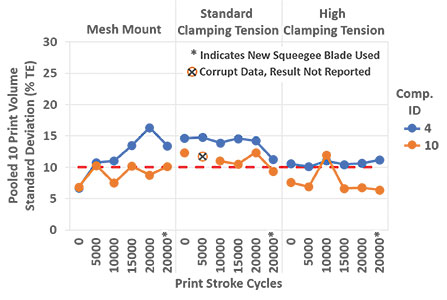
Figure 11. Standard deviations of 0.3mm pitch BGAs, circle apertures, component ID 4 (Shield 2) vs. component ID 10 (Shield 4).
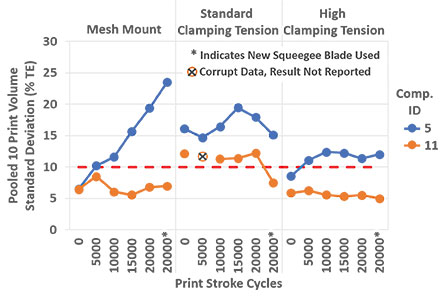
Figure 12. Standard deviations of 0.4mm pitch BGAs, circle apertures, component ID 5 (Shield 2) vs. component ID 11 (Shield 4).
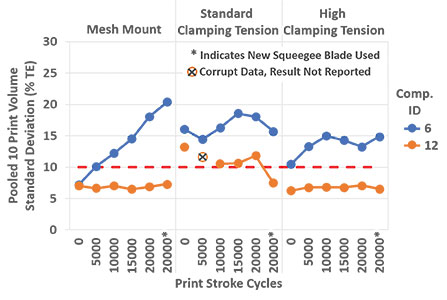
Figure 13. Standard deviations of 01005 passive devices, component ID 6 (Shield 2) vs. component ID 12 (Shield 4).
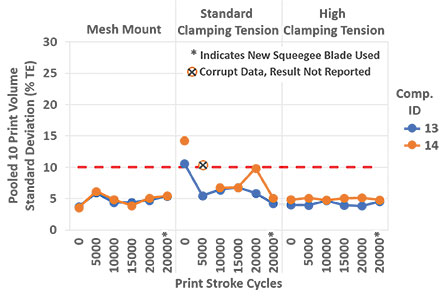
Figure 14. Standard deviations of 0.8mm pitch BGAs, component ID 13 (square apertures) vs. component ID 14 (circle apertures).
Conclusions
This robustness study of three different types of stencils provides interesting insight on the role of stencil tension in printing performance and offers a unique opportunity to implement a new strategy for improving process yield. The most important discovery was identifying that not all aperture regions on the stencil respond equally to the application of foil tension.
Specifically, devices positioned inside the borders of high aperture density shields exhibited the greatest disparity of print quality among the stencils tested. The most significant print uniformity improvements attributed to increasing foil tension were witnessed for components at these sensitive locations. In general, the work suggests a distribution of sufficient tension across the stencil foil capable of maintaining suitable coplanarity throughout the print cycle is required to mitigate print defect opportunities.
A high-tension stencil frame can help safeguard printing consistency in volumetric efficiencies for fine-pitch components across a variety of positional configurations as demonstrated across 20,000 print cycles. Finally, the durability and survivability of the delicate, thin foil tested under the subjected high clamping tension applied was impressive. Further evaluation and technical reporting on the performance of this apparatus are forthcoming.
References
1. I. Fleck, “A New Dimension in Stencil Print Optimization,” Journal of SMT, vol. 16, no. 1, 2003.
2. Stencil Design Task Group 5-21e, “Stencil Design Guidelines”, IPC-7525B, October 2011.
3. C. Ashmore, “Stencil Tension – The Proof’s in the Printing,” CIRCUITS ASSEMBLY, August 2019.
4. M. Whitmore, J. Schake and C. Ashmore, “The Impact of Stencil Aperture Design for Next Generation Ultra-Fine-Pitch Printing,” 35th International Electronic Manufacturing Technology Conference, November 2012.
Ed.: This article is adapted from a paper from SMTA International (October 2019) and is published with permission of the authors.
is product engineer at Plexus (plexus.com); prithvikotian@gmail.com. is senior engineer at ASM Assembly Systems (asmpt.com); jeff.schake@asmpt.com. , is assistant professor at Rochester Institute of Technology (rit.edu); mkamet@rit.edu.


Press Releases
- ViTrox Americas Welcomes Doug Ennis as Senior Field Applications & Service Engineer
- Altus Adds LPKF CuttingMaster 3290 to Depaneling Portfolio
- Kurtz Ersa Partners with E-tronix for Sales in Illinois and Wisconsin
- XLR8 EMS Welcomes Raul Jorge Lopez Jr. as Director of Program Management and Procurement