

2014 Articles
Contaminated bath water skews refractive index results. New technology can accurately measure aqueous cleaning agent concentration.
Numerous critical process parameters must be monitored and controlled to efficiently and effectively yield the expected cleaning results for a qualified cleaning process. For batch or inline spray-in-air cleaners, these include items such as wash temperature, spray bar configuration, nozzle selection, spray pressure, exposure time and cleaning agent concentration. The latter is the most difficult to monitor and subsequently control for as it is progressively compromised, as it becomes loaded with contaminants and in particular, flux residue. For many years, the standard method for assessing wash bath concentration has been refractive index. Its primary instrument, the refractometer, is inexpensive and easy to use, and the process is fast. This is certainly an effective method for measuring a fresh bath, and when combined with pH measurement, an operator can assess the organic and alkaline levels of ingredients in the wash solution. One must note that the refractive index of a medium is a measure of the speed and direction of light passing through the medium, and this is ideal for a pure solution (Figure 1). For a fresh cleaning agent, there is a linear relationship between the refractive index value and cleaning agent concentration.
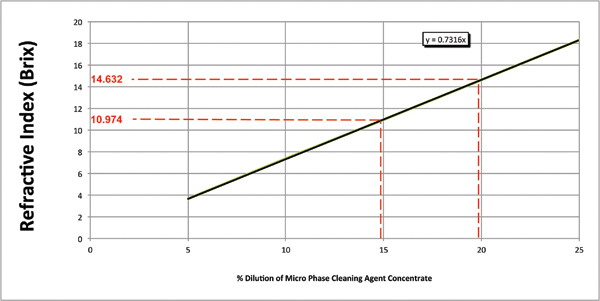
Figure 1. Concentration by refractive index.
In the world of aqueous cleaning, wash baths become contaminated with flux residues over time. Flux residues affect the speed and direction of light as it passes through the sample medium, thereby introducing unpredictable measurement errors.1 This means the measured concentration of the cleaning agent may be significantly over- or understated. For example, the targeted concentration may be 10%. The operator checks the wash bath concentration and discerns through refractive index a concentration of 20%. Thus, DI-water is added to reduce the concentration to the specified level. The actual wash bath concentration may well have been at 10%, and since an erroneous reading was obtained, and the wash bath was diluted, the actual concentration is significantly lower than the desired amount. The result: an out-of-spec process to worsen and therefore unknowingly yield assemblies outside the quality specification. Thus, identifying an improved test method to easily and accurately determine wash bath concentration is critical to an efficient and effectively managed aqueous cleaning process.
How does one accurately determine the concentration of chemistry, or an aqueous-based cleaning solution that comprises flux residues, as well as a wide variety of SMT-related residues that are entrained in a cleaning system wash bath?
For cleaning agent manufacturers that develop and blend their solutions, gas chromatography (GC) is an ideal test method for fresh or uncontaminated product. In this case, all constituents are known to the manufacturer and can be easily identified. When trying to examine contaminated samples with unknown constituents, having to select appropriate columns ahead of the analysis is difficult at best. Complications arising from the presence of unknown components are common to virtually all chemical analysis techniques, including chromatography. Thus, it is necessary to rely on experienced analysts making sensible accommodations for the presence of unknown species based on the fact that major contaminants can be reasonably guessed using flux formulations. It is also necessary to refrain from expecting the same quantitative accuracy, as in uncontaminated samples. With such caveats, GC remains a useful, yet non-practical technique for analyzing contaminated samples.
The chemical situation is further complicated in a mathematical sense by the fact that the total number and type of species within a contaminated wash bath is unknown. If it were somehow known that N different species were present in a sample, selecting a battery of analysis techniques that can give N different analysis values would provide a deterministic signature for the chemical profile. Thus, in such a multi-species environment, the practical approach to characterization is to choose sensing techniques based on their selectivity; that is, one chooses a sensing technique that returns a large signal for the species of interest, and a small or no signal for other species.
Trying to bridge the gap between the inaccuracy of refractive index measurements, when used for contaminated wash baths and the inherent difficulty of analyzing unknown and non-volatile species through the use of GC, has fueled the drive to develop alternate technologies. One approach to maximizing selectivity is to target the chemical behavior of the known components of the cleaning agent. This approach enables the chemists who develop the cleaning agents to choose from a very large universe of possible chemical behaviors and reactions to precisely target the desired species. Therefore, the next step in the evolution of concentration measurement tools was the development of the chemically targeted phase separation analysis technique.
One such commercially available technique is the Zestron Bath Analyzer. This was designed as a targeted physical reaction for the selected cleaning agents. During its development and beta testing, the results obtained using this technique were compared directly against those obtained through GC analysis for both a fresh cleaning agent (Figure 2), as well as a flux contaminated bath at a customer location (Figure 3). In each case, a micro phase cleaning agent was analyzed.
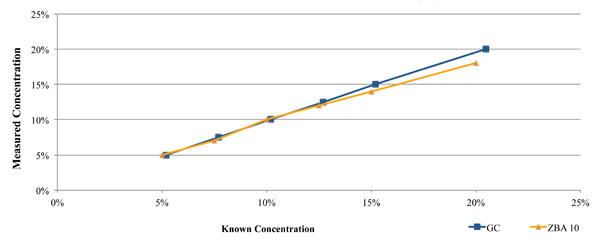
Figure 2. Results of bath analysis compared to fresh micro phase cleaning agent using known concentration.
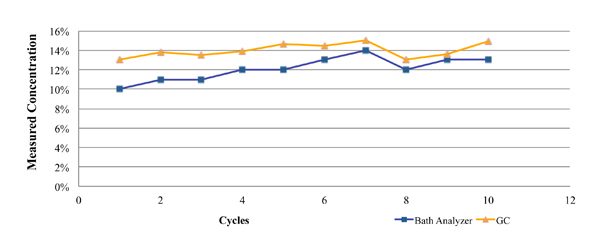
Figure 3. Results of bath analysis compared to fresh micro phase cleaning agent using known concentration.
As seen in Figure 2, the concentration measurement results using the GC and novel techniques accurately indicate concentration when compared directly against the known concentration of fresh aqueous engineered cleaning agent.
Figure 3 represents GC and novel technique data from a customer location. These data were developed through the analysis of partially loaded bath samples collected from a batch cleaning application over a four-week period. As noted in the graph, the concentration as measured by the novel technique closely mirrored that of the GC analysis, with a maximum difference of 3%.
With the novel technique, a wash bath sample may be analyzed in real time. On the basis of this analysis, concentrate or DI-water could be added as required to maintain the desired wash bath concentration. Additionally, when analyzing alkaline products, a color reaction indicates if the alkalinity of the wash solution is satisfactory, which is an indication of wash bath life. The novel technique is a manual process whereby the operator must extract a well-mixed wash sample, typically from the spray bar, monitor the process daily and add concentrate and/or DI-water as required.
Figure 4 represents data from a company that was using an inline aqueous cleaner and micro phase cleaning agent. In this case, there was a wide concentration process window ranging from 12.5% to 20%, with an average of 16.25%. The process was monitored over the course of several weeks by both refractive index and the novel technique, and the concentration manually corrected as required. As can be seen in the graph, it is clearly evident when the concentration drifted and when corrective action was taken – that is, concentrate added to bring the wash solution back into the targeted concentration range. Throughout the testing period, the concentration determined by refractive index continued to be overstated, reaching a maximum reading of nearly 38%. Had the operator reacted to this erroneous reading by adding DI-water, the wash bath concentration would have been significantly diluted, inhibiting cleaning effectiveness and potentially impacting the reliability of the electronic assemblies.
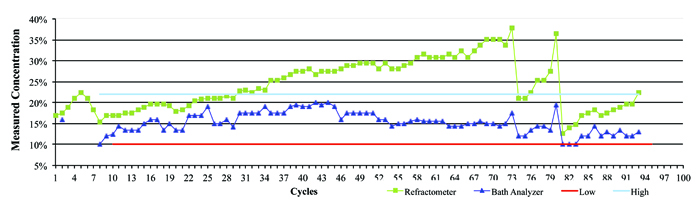
Figure 4. Field data showing refractive index vs. bath analysis.
Since 2009, the novel technique has been recommended as an alternative to refractometry for fast, accurate wash bath concentration measurement. However, the desire remained to develop a method that could indicate accurate wash bath concentration automatically, consistently and in real time.
The authors determined that the solution for assessing wash bath concentration resided in measuring liquid flow concentration “in line” as the wash solution is pumped to the spray bars, for this is the liquid that is in direct contact with the assembly surface during the cleaning process. Careful consideration was given to numerous available sensor options, including capacitance, acoustic and optical. However, identifying a technology and adapting it such that its output can be calibrated for an aqueous-based cleaning agent in the presence of flux residues, as well as other process contaminants, posed a significant challenge.
As noted, fresh wash bath concentration is an engineered aqueous-based cleaning agent, and thus all constituents and their relative proportions are known to the manufacturer. Given this fact, numerous concentration measurement technologies were considered by the authors and ultimately an acoustic method chosen as most appropriate for this application. This decision was made primarily due to its selectivity toward the desired cleaning agents under consideration. However, the authors understood that additional characteristic data of the flowstream were required to account for entrained contaminants. Here, we address the technological advancements made in adapting liquid flow sensor technology in order to develop a concentration monitoring process capable of accurately measuring wash bath concentration in the presence of flux loading.
Methodology
Numerous flux types and engineered cleaning agents are used in electronics manufacturing. To focus this study, the authors decided to conduct all tests using one of the modern cleaning agent types – that is, micro phase technology, herein referred to as the cleaning agent, as well as one flux type. The selected flux type was mildly activated rosin flux (RMA). Given this flux scenario, rosin would be a significant contamination contributor within the wash bath. Thus, for all flow sensing technologies evaluated, a key requirement was minimal selectivity toward rosin.
As discussed, there are numerous methods to determine wash bath concentration. For fresh as well as flux-loaded wash baths, the authors had significant data from in-house tests and customer sites using GC and the novel techniques. Thus, it was decided that the flow sensor concentration data would be compared against GC and the novel technique as a point of reference for concentration accuracy throughout this study. All GC measurements were performed at a Zestron Technical Center.
An acoustic measurement technology was chosen as the most appropriate automated concentration monitoring technique for the aqueous-based cleaning agents. The selected device, called Flowsensor, included an inline flow sensor and digital controller for concentration and temperature display. Ultimately, two types of these novel sensors were evaluated: a handheld benchtop device for single point measurement and an inline device for continuous measurements. Both capture not only acoustic wave data, but also the signal amplitude and signal dampening effect over time. The results of each were found nearly identical.
Utilizing the novel sensors, data from various benchtop experiments as well as spray-in-air cleaner installations were collected. All initial testing was conducted with fresh cleaning agent mixed to known concentrations. Using an algorithmic calculation, the sensor data stream was characterized such that the raw novel sensor data could be converted to a concentration percentage. These data were compared against both GC and the novel technique concentration measurements to evaluate and confirm sensor accuracy.
Figure 5 represents the GC, novel technique and novel sensor data as compared to the known cleaning agent concentration. For the novel sensor measurements, the cleaning agent temperature was 60°C, whereas for refractometry and Bath Analyzer, measurements were taken at room temperature. For GC analysis, the standard temperature protocol was followed.
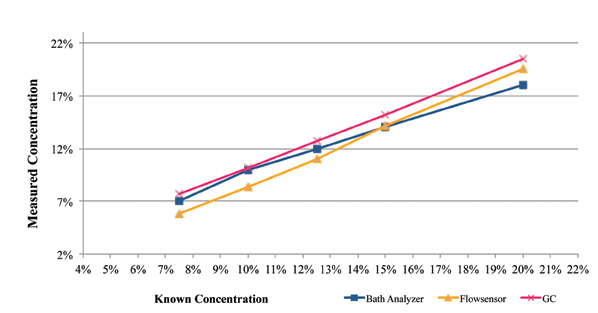
Figure 5. Cleaning agent concentration analysis.
As indicated by this data set, the GC and the novel measurement techniques accurately measured the concentration. The novel sensor measurement was within 1.6% of the known concentration at 10% percent concentration and above.
At this stage of product development, the novel sensor concentration variance was deemed acceptable. The next step was to consider the impact of flux residues on the novel sensor concentration measurements.
The process of analyzing the impact of flux residues was conducted in three stages. Since rosin is a significant component of RMA flux, the authors first examined its
impact on the novel sensor measurements. Following this assessment, the impact of flux residue was examined through controlled tests and, finally, wash bath analysis from beta site testing at a customer location.
A design of experiment was developed and executed in three phases:
Phase 1: Rosin load analysis, to evaluate the impact of rosin on concentration monitoring techniques, including the novel sensor and refractive index.
Phase 2: RMA flux load analysis, to evaluate the impact of various amounts of flux residue on various concentration monitoring techniques, including the novel sensor, bath analysis and refractive index. This test is to be conducted in the absence of any other SMT assembly contaminants.
Phase 3: Beta site test data. Employing the novel sensor, wash bath concentration field data were assessed by direct comparison to the bath analysis, refractive index and GC techniques.
Regarding cleaning agent temperature measurements, all novel sensor measurements were taken at 60°C; refractometry and bath analysis measurements were taken at room temperature, and the standard temperature protocol was followed for all GC analyses.
Main Research
Phase 1: Rosin load analysis. This analysis was conducted in a controlled environment whereby the volume of rosin and known concentration of the micro phase cleaning agent could be precisely measured, mixed and analyzed at a constant temperature.
To facilitate this evaluation, a custom engineered Automated Laboratory System (ALS) complete with the novel sensor (inline) was developed and employed. Initially, a 15% volumetric mixture of cleaning agent in DI-water was prepared. The liquid solution was dosed into the ALS with precise experimental accuracy. Then, measured quantities of rosin were added into this mixture to a maximum of 1.8%. In a typical inline cleaner with an 80-gal. wash tank, 1.8% rosin equates to 6 kg, a significant contamination load.
The rosin content was measured using refractive index and the novel sensor, with the measurement concentration values plotted in Figures 6 and 7, respectively. As indicated in Figure 6, the refractive index concentration measurements of the 15% prepared solution of the cleaning agent ranges from 14% to 28% at 1.8% rosin load. Thus, the refractive index measurement technique is extremely sensitive to rosin content. As indicated in Figure 7, the novel sensor concentration measurements of the 15% prepared solution of the cleaning agent ranges from 14.75% to 14.9%.
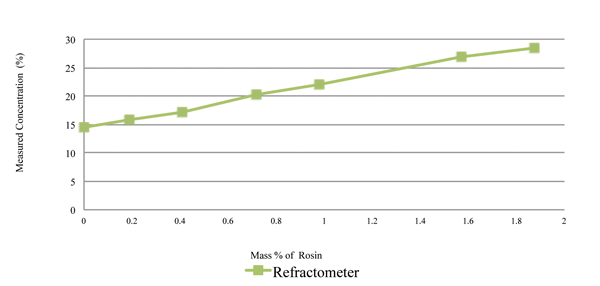
Figure 6. Rosin content measured using refractive index, with 15% cleaning agent and rosin.
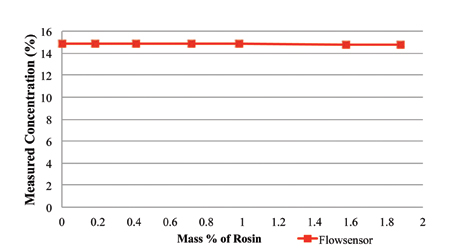
Figure 7. Rosin content measured using the novel sensor, with 15% cleaning agent and rosin.
Figure 8 is a combined graph detailing the impact of rosin on the cleaning agent concentration reading by refractometer and the novel sensor. Thus, acoustic measurement nearly ignores the rosin. It was concluded that rosin greatly impacts the accuracy of refractive index readings, yet has minimal impact on an acoustic measurement technique.
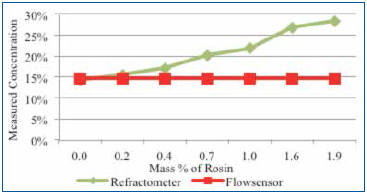
Figure 8. Novel sensor and refractometer results using 15% cleaning agent and rosin.
Phase 2: RMA flux load analysis. To evaluate the impact of flux load on the measurement methodologies, including the bath analysis, refractive index and the novel sensor, the evaluation was executed in two stages:
- Stage 1: Benchtop testing utilizing a 1000 mL beaker and a novel sensor (handheld).
- Stage 2: Installed novel sensor (inline) in the liquid flow line of a spray-in-air batch cleaner and conducted various wash cycles at different concentration levels.
For this test, high solid content RMA liquid flux was sourced. Since these tests were conducted using 1000 mL beakers as well as batch cleaners, concentrated liquid flux was used to minimize the overall flux volume required. To create the concentrated flux, liquid flux was evaporated such that the volume was reduced until it reached the known solid content.
For stage 1, two tests were conducted, Test A and Test B, each one using one liter fresh wash solution samples prepared to known concentrations. For each test, liquid flux with a solid content of 50% was concentrated through evaporation. It should be noted that in the authors’ experience, 3% flux load represents a worst case scenario. Other studies have found the same.2
Typically, one would expect a flux load average of 1.5%, particularly for an inline cleaning system. Generally, flux loading reaches an equilibrium point. As the wash solution is lost due to evaporation and drag out, the concentrated cleaning agent and/or DI-water is added, thereby minimizing the upper limit of flux accumulation.
Test A (benchtop tests): Concentrated flux was added to a 12% concentrate cleaning agent solution in 0.5% increments to a maximum of 3%. Following each flux addition, the concentration was measured by the novel sensor and bath analysis (Figure 9).
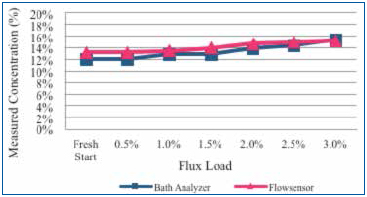
Figure 9. Measure of concentration using novel sensor and bath analysis method as flux influence increases from 0.5% to 3%.
Test B (batch cleaner tests): Concentrated cleaning agent at 7.5%, 10%, 12.5%, 15%, and 20% was prepared. In this case, each concentrated sample was loaded with flux to 3% by volume. The concentration of each flux loaded solution was measured using refractive index, GC and the novel sensor (Figure 10).
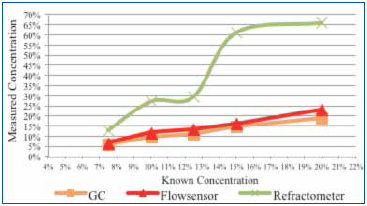
Figure 10. Concentration of each flux loaded solution measured using refractive index, GC and the novel sensor. Flux influence: 3%.
Results. For Test A, the initial wash bath concentration target was 12%. Fresh bath concentration readings were 12% and 13%, as indicated by the bath analysis and the novel sensor, respectively. As the flux concentration increased, the indicated wash bath concentration increased to 15%, as shown by both measurement methods. Note that the indicated concentration value for either measurement technique varied by approximately 1% at a flux load of 1.5%. In this experiment, the flux addition induced a maximum intrinsic error of 3% at a concentrated flux loading of 3%.
For Test B, five concentrations, each loaded with 3% flux by volume, were measured using GC, the novel sensor and refractive index. As expected, refractive index measurements increased exponentially as the cleaning agent concentration increased, greatly overstating the concentration. On average, GC understated the known concentration by 1%. The novel sensor measurements overstated concentration by a low of 0.77% (5.77% vs. 5%) to a high of 2.94% (22.94% vs. 20%).
For Stage 2, the novel sensor (inline) was installed in the wash pump discharge line of a spray-in-air batch cleaner. The process settings used for this test are detailed in Table 1.
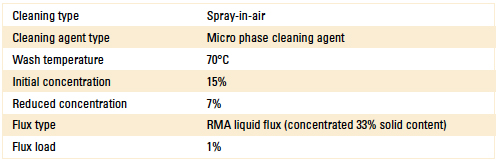
Table 1. Batch Cleaner Process Parameters
The wash tank was filled with fresh cleaning agent to an initial concentration of 15%, as verified by refractive index, bath analysis and the novel sensor. The cleaner basket remained empty, as this test was examining the effect of flux load on concentration measurement only. For this test, the liquid flux solid content was 33% and again concentrated through evaporation.
Following cycle start, flux was added, then diluted, and concentration re-measured employing refractive index and the bath analysis. The novel sensor continuously recorded wash bath concentration throughout the test.
Results. The initial wash bath concentration measured by refractive index and bath analysis was confirmed at 15% concentration.
Flux was added to a concentration of 1% by volume. During this wash cycle, the novel sensor measurements remained fairly constant throughout (Figure 11). At time t2, the bath analysis measurement remained accurate, yet the refractive index measured 22% (actual 14%). The wash bath was then diluted with DI-water. The novel sensor measured 7% as also indicated by the bath analysis, yet the refractive index measured 15%.
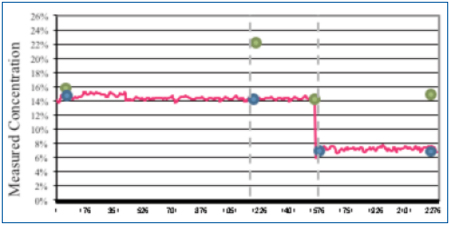
Figure 11. Concentration change analysis.
As expected, in the presence of flux residue, the refractive index reading overstated the wash bath concentration in both instances. At a 1% flux load, both the novel sensor and bath analysis very accurately indicated wash concentration, even as it was diluted by half.
Phase 3: Beta site test data. Based on the results of Phase 1 and 2 of the DoE, the authors proceeded with evaluating the novel sensor at a customer beta site. In this case, the customer had a qualified cleaning process for many years using an inline spray-in-air cleaner. Process parameters are detailed in Table 2.
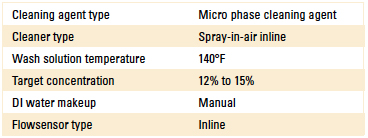
Table 2. Inline Cleaner Operating Parameters
Upon installing the sensor, a fresh wash bath was added and the concentration adjusted to the 12% target. As the customer monitored the concentration, DI-water was manually added using a dosing pump that was manually actuated as required. For this study, single point measurements were taken daily for four days following the initial startup using refractive index, the novel technique and novel sensor plotted in Figure 12.
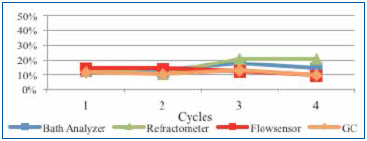
Figure 12. Beta site concentration readings.
The fresh wash bath concentration readings were very close between all measurement techniques at startup. However, as the production week progressed, concentrate and DI-water were added as required, as contaminants began to accumulate in the wash bath. Refractive index readings initially dropped and then increased, overstating concentration. The novel technique, GC and novel sensor measurements tracked consistently throughout the remainder of the week. Although this data stream is positive but limited, the customer is continuing to use and evaluate the measurement technology.
Conclusion
It is critical to determine the wash bath concentration, particularly as it becomes loaded with flux residue and other contaminants. Incorrect concentration measurements will lead to incorrect wash bath concentration adjustments. If the concentration is overstated, DI-water will be added, increasing dilution and potentially resulting in poor cleaning results and subsequently product reliability concerns. Alternatively, if the concentration is understated, concentrated cleaning agent will be added, increasing the wash bath concentration and the potential for material compatibility concerns.
The wash bath flux loading rate is certainly variable depending on the flux type used, solid content, board complexity, reflow profiles, and production volume to name a few. In this study, the flux analysis was limited to RMA. Rosin was shown to have a major impact on the accuracy of Refractive Index contributing to the overall inaccuracy of this measurement method. Alternatively, the rosin impact on the acoustic measurement device was minimal, thereby reducing its intrinsic measurement error.
GC can certainly be used for concentration measurement, even with contaminated samples. However, due to its cost and complexity, it is not feasible to use at the assembly plant level on an ongoing basis. The novel technique is a feasible alternative offering reasonable measurements – that is, within several percent of the target concentration as compared with GC analysis. This is a manual method and subject to human error.
Alternatively, the novel sensor as described herein, or the acoustic liquid flow measurement technique, is an inline device that continually and automatically monitors, records and displays the wash bath concentration in real time. Through the series of tests conducted and presented within this study with both fresh and RMA flux loaded cleaning agent, the authors have demonstrated that the novel sensor, once characterized for the specified cleaning agent and expected contaminants, accurately measures wash bath concentration in the presence of flux residue. For a wash bath solution loaded with 3% flux, the measurement overstated the target concentration in the range of 0.7% to 3%, depending on targeted concentration. The intrinsic error was less at a reduced flux load.
For this study, field data were limited yet consistent with the study test data and will continue to be collected.
Acknowledgments
Special thanks to Kester for providing the flux samples used for this study.
References
1. H.Wack, “Limitations of Refractive Index,” CIRCUITS ASSEMBLY, April 2009.
2. William T. Wright, “Managing Wash Lines and Controlling White Residue by Statistical Process Control,” Proceedings of SMTA International, September 2003.
Ed: This article was originally published in the proceedings of SMTA International, October 2013, and is reprinted here with permission of the authors.
Umut Tosun is an application technology manager, and Axel Vargas is a sales engineer at Zestron (zestron.com); umut.tosun@zestronusa.com. Bryan Kim, Ph.D., is director of engineering at Pressure Products (pressureproducts.com); bhkim@pressureproducts.com.
A systematic approach to nonconventional methods of encapsulant removal.
An unfortunate reality is that the circuits we assemble do not always perform as expected. Failure analysis is frequently needed to find root causes. In such cases, it is common to encounter components encapsulated with materials that must be removed to permit inspection. While “decapsulation” methods are well documented, with many guides available to help with products and “recipe” selection for concoctions to remove encapsulants (ASM Microelectronics Handbook, Dynaloy data sheets, etc.),1 the analyst will encounter materials in which standard methods, such as use of fuming nitric, sulfuric acids or commercial deprocessing products, fail to produce the desired outcome.
Most often, this poor outcome arises because the chemicals used to remove encapsulants also attack the materials of interest. For example, using nitric acid on sites composed of copper wire bonds results in almost no chance of the copper remaining unmolested for further analysis. This highlights the “magic bullet” misconception – belief that a chemical can be found that selectively attacks only the materials wanted, while not altering materials of interest.
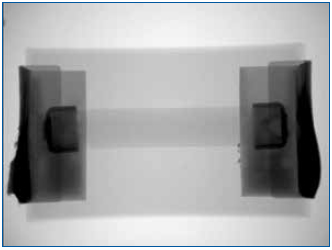
Figure 1. Overall resistor construction revealed by x-ray imaging.
Methods such as breaking parts simply by fracturing or cleaving, burning away materials in a furnace, use of unconventional chemicals, or mechanical methods can often overcome standard methodology limitations and permit successful removal of encapsulants, while maintaining the integrity of the materials of interest. A systematic approach to such challenges and examples in which the Raytheon Failure Analysis Lab in McKinney, TX, addressed some of these are highlighted here.
In all things, it is generally a good idea to think about how to proceed before actually undertaking a task. In the case of decapsulation, several fundamental questions should be asked:
- What is the composition of the materials to be removed?
- What is the composition of the materials that are expected to be revealed?
- What are the properties of the materials?
- How will the materials respond to the decapsulation process?
The answers are crucial with regard to choosing the proper methods to remove the encapsulation while preserving the materials of interest. Labs that perform such procedures on a regular basis are certainly aware of such issues and likely have common procedures in place. A typical protocol might follow a procedure such as:
- Identify material compositions from data sheets or analysis in the lab. (FTIR spectroscopy is a quick method for determining most material classes of interest.)
- Consult a materials chart that provides guidelines as to proper procedures. For example, many suppliers of decapsulating agents provide charts that indicate which of their products to use for each material type.
- Follow proper procedures, with safety a key concern, and monitor the components at regular intervals to achieve the desired penetration, while maintaining the exposed materials’ integrity.
As mentioned, such procedures are typical and apply to most applications. However, the analyst also encounters examples in which standard procedures will not work and creativity is needed in planning the proper exposure route. The remainder of this article will focus on a few such examples faced by our lab and highlight the rationale behind these often unconventional approaches.
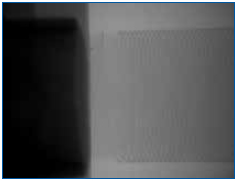
Figure 2. No fractures in the element or issues related to the end cap weld joint could be resolved.
Why Not Burn It Off?
It may seem counterintuitive that burning away material is an acceptable approach; after all, such a method is aggressive, seemingly difficult to control, and not very selective. However, in some cases, in which the goal is the burning away of combustible materials to reveal noncombustibles such as metals, the approach can overcome limitations of other more traditional techniques. For example, if the purpose of the decapsulation is to reveal fine metal features such as wires of a resistor, small bond wires, and others, the use of strong acids such as nitric often results in dissolution, or at least attack, of the metals of interest.
In the following example, multiple wire-wound resistors were failing in an open condition once installed on an assembly and exposed to environmental testing. X-ray analysis could not resolve an open condition in the nickel-chromium element. Therefore, a method was devised to selectively remove the encapsulant without affecting the fragile element, thus permitting further detailed inspection.
The package design was such that the wire element was wound over an alumina core with a heavily glass-filled encapsulant. Such a design seemed ideal for furnace removal of the encapsulant, as the materials to be revealed are capable of withstanding exposure to 500˚ to 600˚C and flames resulting from the burning of the epoxy. In this case, the leading concern was to avoid mechanically disturbing the delicate wires during the process. To ensure the approach was reasonable, a known good component was subjected to the proposed methods and found to pass electrically on decapsulation, an indication that the method did not damage the element.
The method was composed of the following steps:
- Packages were exposed to 500˚ to 600˚C in an appropriate furnace. Samples were monitored to determine complete combustion of the packaging epoxy (about 5 min).
- Packages were examined for completeness of the process. In such examples, very close control of the heat can overcome the problem encountered: the glass filler fused, forming a secondary layer that needed to be removed. Ideally, if the combustion heat is maintained at a sufficient temperature to burn away the polymer but not fuse the glass, the filler can be gently, mechanically removed. Unfortunately, in many cases, such as this example, the glass forms a secondary material that must be removed before the inner package surfaces are revealed.
- The fused glass was digested using hydrofluoric acid. After burning away of the epoxy, the package was placed in concentrated hydrofluoric acid with stirring, and monitored for complete removal of the glass. This is a weak acid that is very selective for glasses and very mild to most all metals. (There are exceptions.)
Figure 3 shows that the resistive element appears to be disturbed in areas adjacent to the fracture site indicated; this is due to a lack of tension in the wires at this region (due to the fracture) coupled with gentle agitation of the wires in the hydrofluoric acid. Regardless, the fracture site was easily identified and characterized.
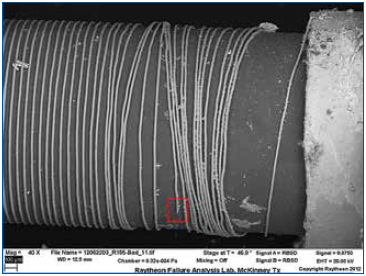
Figure 3. Wire revealed on alumina core.
Figure 4 reveals features that indicate the wire was corrosively attacked. Additional failing samples were evaluated using the same deprocessing methods, and similar features were identified at the fracture locations. These were always in close proximity to the end cap terminations; this suggested that a contaminant may have “wicked” in during processing or environmental exposure. Although this deprocessing technique was useful in identifying the failure mode (corrosive attack), root cause had not been established, and any possible chemical agents that may have contributed to the corrosion were removed by the procedure.
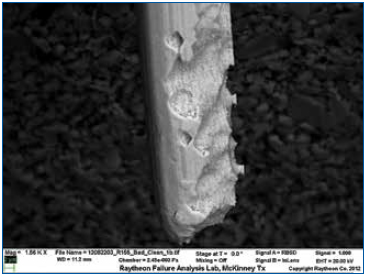
Figure 4. SEM figure of Nichrome wire at fracture site.
In addition to the example cited, we have successfully deprocessed several parts using the furnace approach at such times when it is applicable. For example, in another case, very small aluminum wires encapsulated in a soft urethane coating were not revealed by x-ray examination. Burning away the potting in the furnace allowed us to successfully characterize the wires.
Mechanical Methodology to Minimize Chemical Exposure
Purely mechanical deprocessing methods were employed to test the chemical “wicking” hypothesis presented in the previous example. In such a process, no chemicals can be used that may contaminate the device or even remove suspect contamination. In this analysis, we had the luxury of multiple failing samples to utilize different complementary deprocessing methods. A subset of the failing devices was mechanically deprocessed using a cleaving tool to separate the molding and expose the element. Obviously, this technique was never intended to preserve the condition of the fragile element.
Isopropyl alcohol extracts of contaminants on the exposed element were captured and evaluated using GC/MS (gas chromatography/mass spectrometry) methods. The presence of glycerin was identified on all failing devices, a good target compound indicating the presence of water-soluble fluxes. Consultation with the supplier revealed that they did indeed use a water-soluble flux with these devices. As a result, a good device was similarly deprocessed and exposed to the flux with power applied to test the assumption that such exposure led to the open. Similar corrosive attack was noted. Corrective actions included changing to a more benign flux.
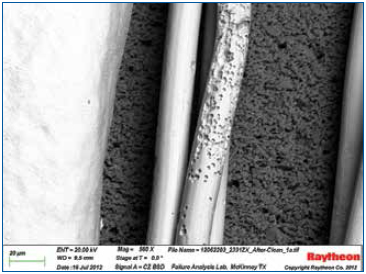
Figure 5. Corrosive attack resulting from the wire being exposed to water-soluble flux while powered.
This example highlights the use of hydrofluoric acid for digestion of glass, much like the previous example, but is used on a package that traditional methods were also employed. The semiconductor package displayed in Figure 6 contains stacked die and is configured with an interposer board. Upon visual inspection, the molding compound appeared to have a shiny smooth surface. (FTIR analysis showed this to be a heavily glass-filled epoxy.) To decapsulate, the package was submitted to the traditional methodology using fuming nitric acid. The molding compound displayed only limited removal using this approach. This was determined to result from the extremely high glass content in the encapsulant. (In such cases it is perhaps more useful to think of such materials as glass with polymer binder than a glass-filled polymer.) While the nitric acid was effective at removing the polymer, the glass at the outermost exposed layer concentrated, forming a barrier unaffected by nitric acid. It was decided a multi-step process alternating between nitric and hydrofluoric acids would address this issue. After the nitric acid ceased to be effective, 49% hydrofluoric acid was applied to the top layer for a minute or so. After this, the hydrofluoric acid was rinsed away and nitric acid was reapplied. This sequence was repeated three times, and decapsulation was successful.
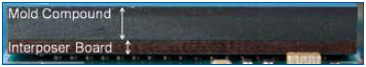
Figure 6. A heavily glass-filled epoxy encapsulant.
The Problem with Silicones
Silicones are ubiquitous materials used in a multitude of applications, including coatings, underfills, thermal transfer compounds, adhesives, and others. It is desirable in many instances that such materials be removed from components during deprocessing. One of the most common methods is to soak these materials in solvents such as xylenes or hexanes, swelling and softening them for ultimate mechanical removal. This presents obvious issues when deprocessing delicate assemblies, such as mechanically destroying fine features during the removal process. Also, while a few silicone removal products are available from commercial sources, these rely on corrosive additives that digest the silicone rather than simply dissolving them. Such aggressive materials may compromise sensitive materials, and swelling often still occurs.
While we would like to claim credit for the following solution (we cannot), we have found scarce reference to a method reported by Sachdev.2 While the focus of the referenced article is silicone adhesives, we have found it equally applicable to all silicones we have tested, including condensation, and addition cure materials, including thermal transfer media, pottings, and “RTVs.”
We found that application of a solution of 1% tertabutylammonium fluoride (TBAF) in propylene glycol methyl ether acetate (w/v), as described by Sachdev, heated from 50˚ to 90˚C with gentle stirring works exceptionally well to remove silicones and not damage sensitive materials. (Higher heat and solutions with greater concentrations of TBAF proved to accelerate the digestions.)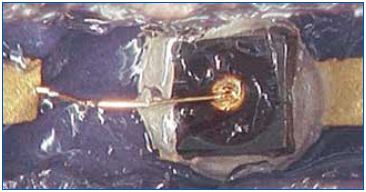
Figure 7. Bond wire prior to silicone removal.
In the following example, a silicone potting covered very fine bond wires of a diode in a hermetic package. The goal was to examine the diodes and perform a bond-pull on the wires to document possible degradation modes after highly accelerated life testing (HALT). The typical methods of removing the silicone invariably caused dimensional changes in the silicone, which imparted an undesirable stress on the wires.
The new method was tried on a few test samples, and the results were excellent. No damage or deformation was observed. Bond-pull results compared favorably with the devices under test.
Another example of this technique that demonstrates its value is the failure investigation of a complex product with multiple layers of material. The failure scenario suggested the likelihood of broken bond wires. A partial view of the component is shown in microsection (Figure 8). The materials in this view are labeled, and the objective was to expose the wires for evidence of fracturing somewhere along the wire or at the bonds. Sectioning in silicone to reveal fine features cannot achieve this objective. Using traditional methods, once the silicone is exposed, the approach leads to swelling, cracking or other dimensional changes that could induce the very same damage in the bond wires that we are attempting to uncover.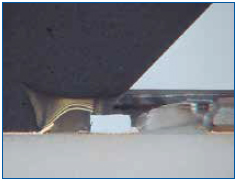
Figure 8. Cross-sectional view of device.
This technique was used to dissolve the silicone after the epoxy over-mold was removed. This was first tried on a known-good and new test sample. Results are shown in Figures 9 and 10. There was no deformation of the bond wires. Subsequent attempts on failed samples allowed us to confirm fine heel fractures in the bond wires. Finally, Figure 11 shows how the method permitted fine details of the exposed bond wires to be recorded.
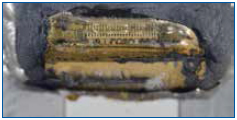
Figure 9. The silicone-encapsulated wires are visible after the epoxy was removed.
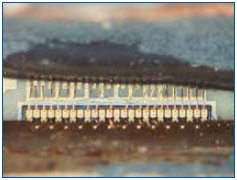
Figure 10. Wires shown after silicone removal. No deformation or damage was detected on the test samples, and heel fractures were found on the failed samples.
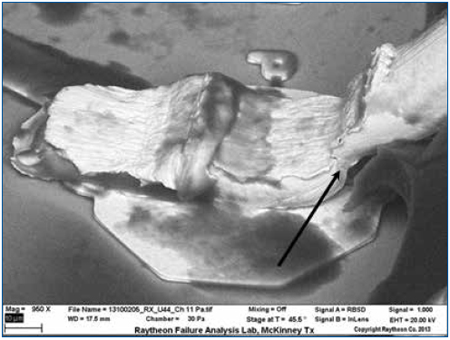
Figure 11. SEM of the wire bond shows that the silicone encapsulation has been sufficiently removed to permit inspection of fine details. Crack initiation is visible in the neck-down region (heel) of the wire.
Standard decapsulation methods are not always applicable, and the analyst must devise approaches to circumvent their limitations. While certainly not exhaustive, a few examples that provided unique challenges to our lab were highlighted. These were selected to show that, at times, unconventional solutions to such problems, when devised with materials variables in mind, can often prove quite effective.
References
1. The SAE G19A Test Laboratory Standards Development Committee will soon be releasing a decapsulation standard. Also, a web search of the terms “decapsulation of electronic components” will result in many additional references.
2. Krishna G. Sachdev, Ph.D., “Removing Cured Silicone Adhesive from Electronic Components," Solid State Technology, October 2010.
W. John Wolfgong, Ph.D., is a chemist; Jana Julien is a failure analyst; Jason Wheeler is a failure analysis engineer, and Joe Colangelo is a principal failure analysis engineer at Raytheon Space and Airborne Systems, Component Engineering Department (raytheon.com); wolfgong@raytheon.com.
Can improved flux coatings on solder preforms reduce voiding?
Void reduction is a critical challenge in electronics assembly, especially for bottom terminated components (BTC) such as QFNs (quad flatpacks no-leads). Excessive voiding inhibits heat transfer between the thermal pad on the QFN and the PWB pad. Flux-coated solder preforms have been shown to significantly reduce voiding.1 Here, the investigators studied the effects of flux coating improvements on voiding.
Sample preparation and experimental procedure. Eutectic SnPb or SAC 305 solder preforms were placed between two ENIG coated 1.25" x 0.375" x 0.008" copper-oxidized and non-oxidized substrates and reflowed in air (Figure 1). To ensure statistical confidence in the results, 30 samples were evaluated at each experimental condition. Half the experiments were performed with a typical flux coating (A) and the other half with a new flux (B). No mechanical pressure was used on the substrates during the ramp-to-peak reflow processes. A statistical comparison of the voiding performance of the two fluxes was then performed.
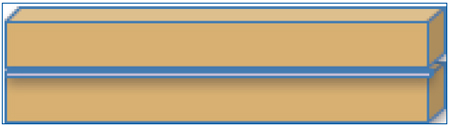
Figure 1. In the experiment, two ENIG-coated copper substrates were reflowed with flux-coated solder preforms. Half the copper substrates were oxidized.
Flux B is a halogen-free flux in 1% formulations.
The typical flux coating formulation (A), also at 1% concentration, produces inconsistencies and gaps in the flux coating, as seen in Figure 2. Gaps and inconsistencies often result in more voiding.
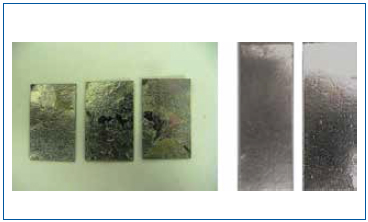
Figure 2. Gaps and inconsistencies in Flux A (left) will often result in more voids compared to Flux B.
All samples were processed in an air reflow, ramp-to-peak profile. Data were collected to measure the void content after reflow using x-ray imaging
(Figure 3).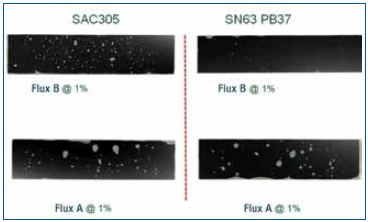
Figure 3. Flux voiding was measured from the x-ray images. Note the much lower voiding level for Flux B.
Data Analysis
SAC 305 non-oxidized substrates. All experiments were performed with 1% flux formulations. A boxplot of voiding data for the non-oxidized SAC 305 substrates for both flux types is shown in Figure 4. The mean voiding value for the substrates treated with Flux B was 1.39%, whereas the value for substrates treated with Flux A was 2.79%. Performing a two sample t-test analysis indicated that Flux B produced fewer voids than Flux A with a statistical confidence of >99.99%.
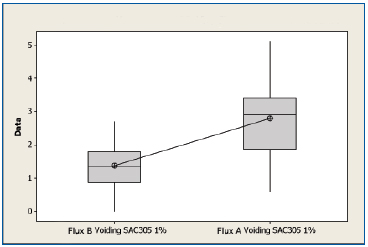
Figure 4. Boxplot of voiding data for non-oxidized SAC 305 substrates coated with Flux A and Flux B. Statistical confidence: >99.99%.
SAC 305 oxidized substrates. A boxplot of the voiding data for the oxidized SAC 305 substrates for Flux A and Flux B is shown in Figure 5. The mean value for the substrates treated with Flux B was 1.79%, whereas the mean value for substrates treated with Flux A was 2.71%. Performing a two sample t-test analysis indicated that Flux B produced fewer voids than Flux A with a statistical confidence of >99.9%.
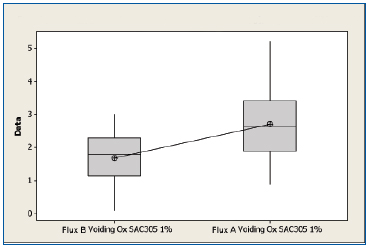
Figure 5. Boxplot of voiding data for oxidized SAC 305 substrates coated with Flux A and Flux B. Statistical confidence: >99.9%.
SnPb non-oxidized. A boxplot of voiding data for the non-oxidized SnPb substrates for both fluxes is shown in Figure 6. The mean voiding value for the substrates treated with Flux B were 0.327%, whereas the substrates treated with Flux A was 1.89%. Performing a two sample t-test analysis indicated that Flux B produces fewer voids than Flux A with a statistical confidence of >99.99%.
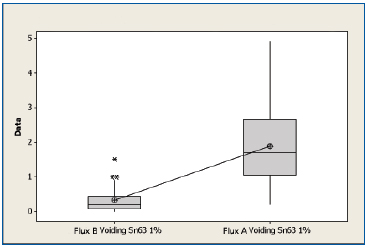
Figure 6. Boxplot of voiding data for non-oxidized SnPb substrates coated with Flux A and Flux B. Statistical confidence: >99.99%.
SnPb oxidized. A boxplot of voiding data for the non-oxidized SnPb substrates for both fluxes is shown in Figure 7. The mean voiding value for the substrates treated with Flux B was 0.197%, whereas the value of the substrates treated with Flux A was 2.29%. Performing a two sample t-test analysis indicated that Flux B produces fewer voids than Flux A with a statistical confidence of >99.99%.
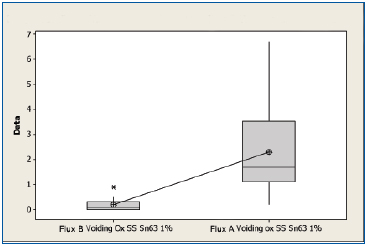
Figure 7. Boxplot of voiding data for oxidized SnPb substrates coated with Flux A and Flux B. Statistical confidence: >99.99%.
Summary
Void data are summarized in Table 1. In all cases, there is a strong statistical confidence that Flux B performs better than Flux A. The new Flux B is halide-free and improves wetting. Flux B coats the solder preform more uniformly to further improve wetting. These features significantly reduce voiding when preforms are used with BTCs such as QFNs. Additionally, Flux B leaves less flux residue.
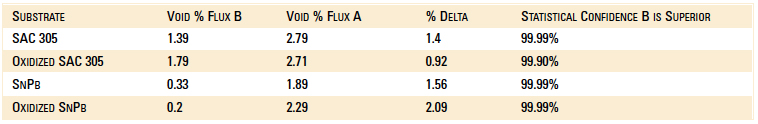
Table 1. Voiding Data Results
References
1. Seth Homer and Dr. Ronald C. Lasky, “Minimizing Voiding In QFN Packages Using Solder Preforms,” IPC Apex, February 2012.
Seth Homer is assistant product manager engineered solders, thermal materials and NanoFoil preforms at Indium (indium.com); shomer@indium.com. Dr. Ronald C. Lasky is senior technologist at Indium.

Press Releases
- Altus Group Invests in Major Headquarters Expansion to Showcase Complete Turnkey Manufacturing Capability
- ViTrox Americas Welcomes Eric Cruz as Technical Support Engineer
- ECD Strengthens Engineering Team with New Software Development Hire
- ViTrox Americas Welcomes Doug Ennis as Senior Field Applications & Service Engineer