

Performance Comparison of Contemporary Stencil Coatings and Underwipe Solvents on 0.4mm BGA Packages
Should chemistry formulation and drying time factor into solvent selection?
The practice of periodically wiping excess solder paste off the side of the stencil that contacts the PCB during the printing process can take many different forms and frequencies. The objective of wiping is to remove unwanted solder paste from the contact side of the stencil.
How does solder paste find its way to the contact side of the stencil? By nature, solder paste sticks to both the PCB pad and the stencil. It does not fully release from the aperture upon separation, depending on the area ratio (AR) of the aperture. Very often, transfer efficiency (TE), or the amount of solder paste removed from the aperture, is less than 100%. The remaining paste often forms “strings” that snap back to the stencil’s contact side (Figure 1).
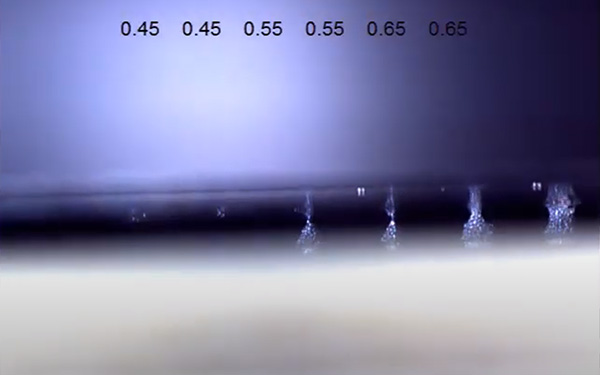
Figure 1. Solder paste release from stencil, side view.
How does errant paste on the contact side of the stencil affect print quality? The solder paste left on the bottom side of the stencil prevents it from gasketing against the PCB and is often the root cause of excessive solder deposits, solder bridges and solder balls. Therefore, it is important to remove the excess paste before it negatively affects the process.
The underwipe process itself has a number of variables, including printer hardware capabilities, wiper media type (paper or fabric), solvent type (if any) and number of prints per wipe cycle (prints per wipe, or PPW). These process parameters are typically adjusted based on systemic variables such as PCB layout, solder paste type, machine capability, board support, stencil coating and finest pitch components, as seen in the fishbone diagram of Figure 2.
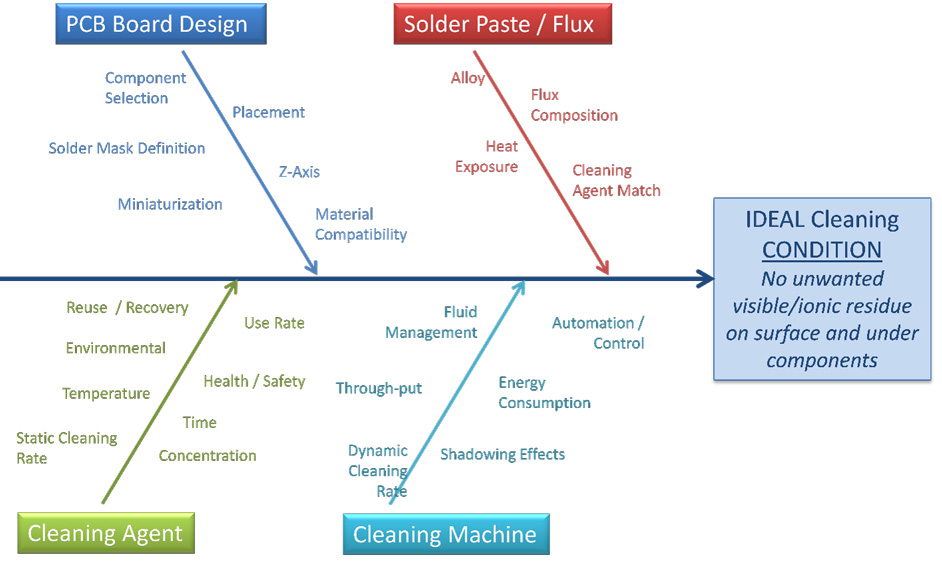
Figure 2. Factors that affect stencil cleanliness.
Previous Work
The role of underwiping on solder paste print quality was diligently studied in the mid-2010s. Research investigated the effects of print parameters, stencil types, stencil coatings, underwipe chemistries and wipe sequences.1-5
Findings included:
- Wet wipe was better than dry wipe.1
- IPA could seize up certain solder paste formulations in the stencil.1
- Release speed had a considerable influence (faster is better).2
- Solder paste “strings” upon release.3
- Coated stencils limit the stringing and improve release.4
- Ending with a vac pass is better than ending with a dry pass.1
- Wet wipes keep the process consistent and limit the “bounce” seen with dry wipes.5
Videos showing the effectiveness of wet-vac-vac over wet- vac-dry can be seen here.
Experiment
Procedure. Leveraging knowledge gained in the aforementioned studies, an experiment was designed to test components in numerous package sizes and different wipe frequencies. Figure 3 illustrates the experimental design. The experiment was executed on production equipment that included:
- EKRA Serio 4000 printer
- Clean, new squeegee blades
- Solid board support plate
- Poly/cellulose wiper textile
- Two laser-cut stencils, one coated and one uncoated
- Two different underwipe chemistries
- Mycronic Pi solder paste inspection (SPI)
- Type 4 Tin-lead solder paste (popular, 20+ year old formulation).
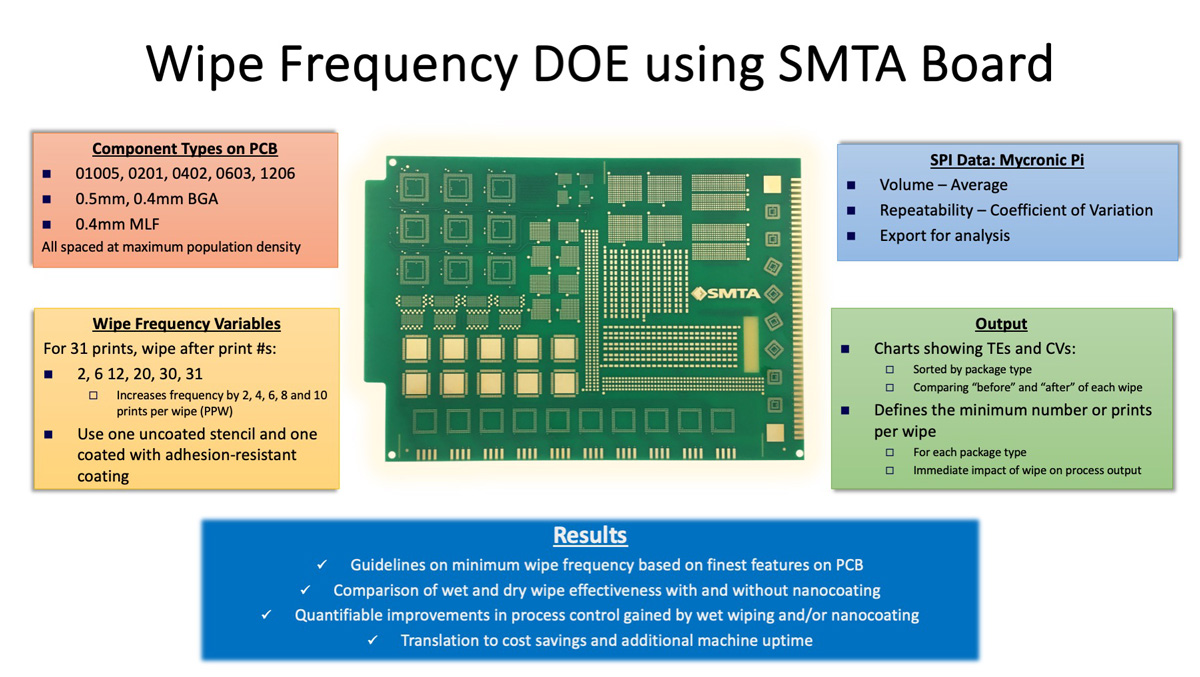
Figure 3. Underwipe experimental design overview.
After kneading four strokes to ensure the solder paste was in its working viscosity range, the stencil was cleaned with a wet-vac-vac (WVV) wipe sequence twice to ensure cleanliness at the start. Two boards were printed, for two PPW, then the stencil was cleaned with a single WVV. This was repeated at wipe intervals of 4, 6, 8 and 10 prints. Two replicates were run for each combination of stencils and chemistries.
The experiment was later repeated without cleaning chemistry. The setup was identical, but the wipe sequence was vac-vac-vac (VVV) without any chemistry.
The order of execution is detailed in Appendix A.
Test vehicle. The test vehicle used was the SMTA test board (Figure 4). It contains footprints for many different sized SMT components. The component sizes of interest in this study are analyzed in the order of decreasing aperture sizes (Table 1).
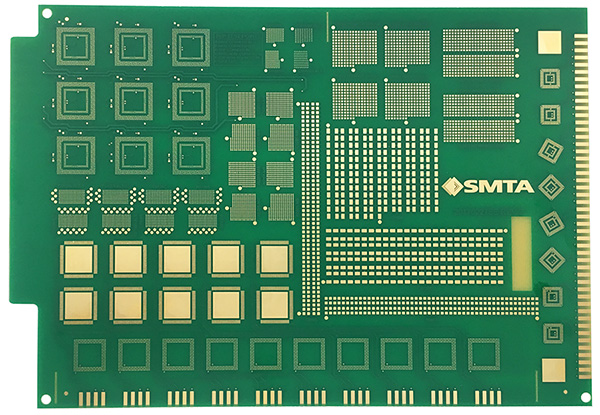
Figure 4. The SMTA miniaturization test vehicle.
Table 1. Device and Aperture Sizes Tested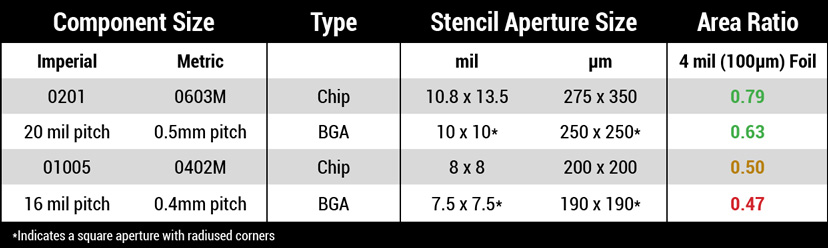
Data analysis. Transfer efficiencies (TEs) were exported and consolidated in Excel. Again, TEs express the amount of solder released from the stencil and deposited on the pad as a percentage of the theoretical aperture volume for each deposit.
TE statistics are calculated using pivot tables. The average TEs and coefficients of variation (CVs) are calculated for each component size. The CV is one standard deviation divided by the average. It relates the spread of the data to their mean and is widely used in characterizing stencil printing processes.
Ideally, the CV is less than 10% of the mean, indicated in the output charts by green data points. CVs of 10-15% are considered acceptable and indicated by yellow data points; CVs greater than 15% are considered unacceptable and indicated by red data points.
The rationale behind the CV guidelines is based on a normal distribution of data and typical SPI tolerances of 50-150% the TE goal, as illustrated in Figure 5.
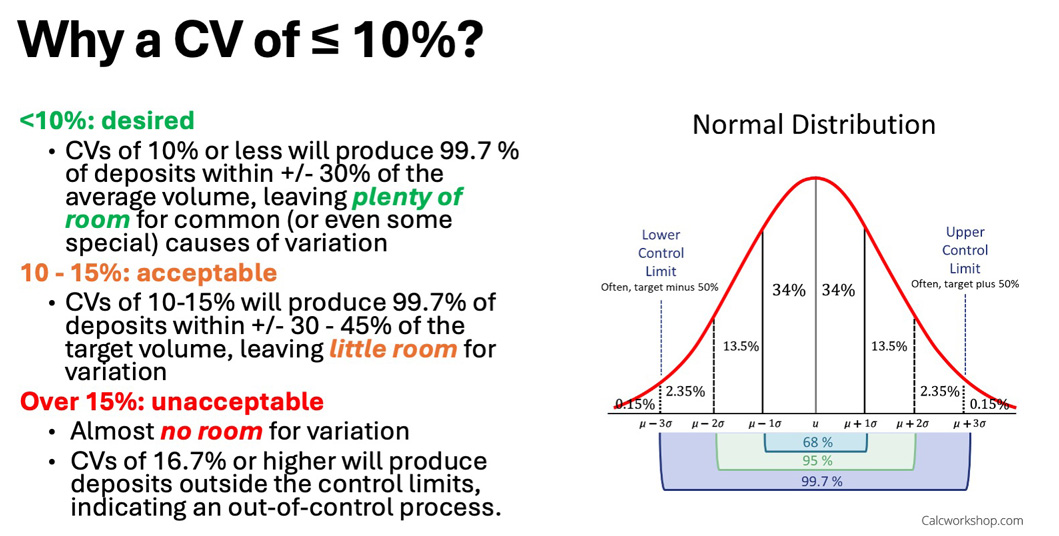
Figure 5. The normal distribution and coefficient of variation.
Analytical Methods and Results
Overall print quality. Print volumes were extremely consistent, indicating a very well-controlled print process.
- 0201 and 0.5mm BGA components all showed >100% transfer efficiency (TE), with nearly all CVs under 10% and only a few in the 10-15% range, on both coated and uncoated stencils (Tables 2 and 3).
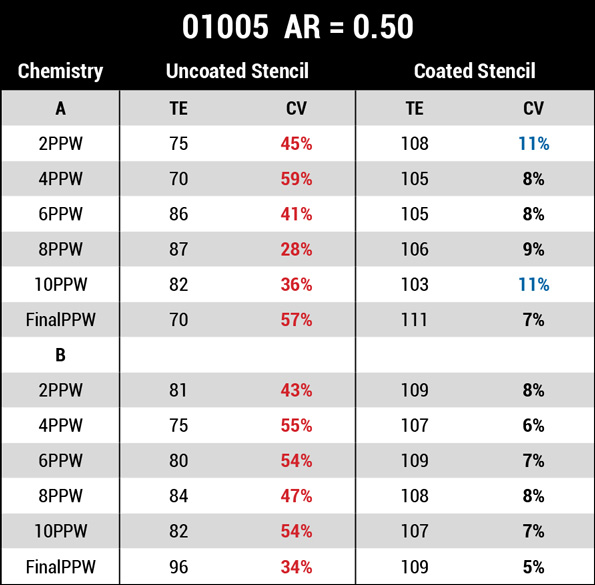
- 01005 components showed an obvious trend: The coated stencils produced CVs of at most 11%, whereas the uncoated stencils produced CVs of approximately 30-60% (Table 4).
Table 2. TE and CV for 0201 Components
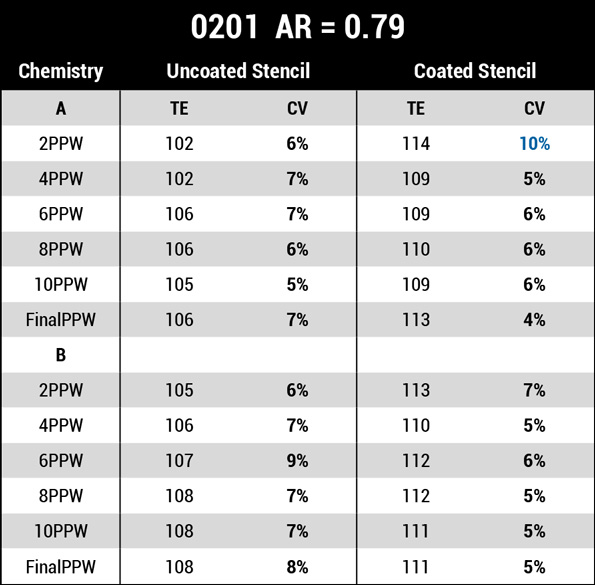
Table 3. TE and CV for 0.5mm Pitch BGA Components
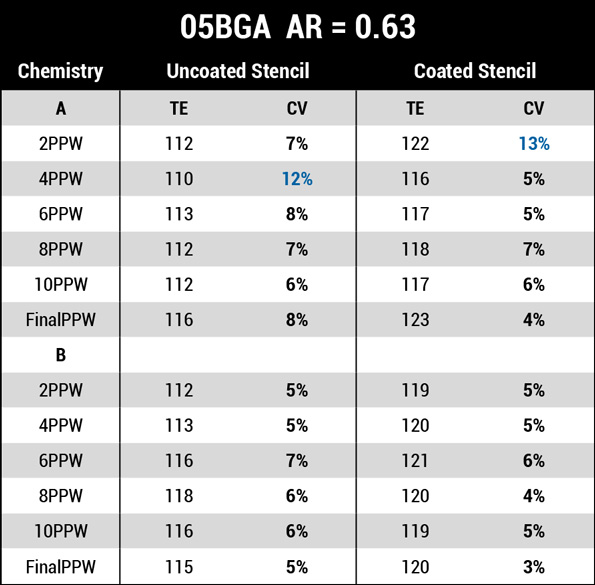
Table 4. TE and CV for 01005 Components
This finding illustrates the influence of coating stencils for miniaturized devices. At the AR of 0.63, the coating’s impact was not apparent. Using wet wipes, the process was capable even without stencil coating. But at the 0.50 area ratio, it was far from capable without the coating, even with wet wipes and at short wipe intervals.
- The process window for the uncoated stencil closed somewhere between the 0.63 and 0.50 AR, but did not noticeably narrow for the coated stencil until the 0.47 AR (Table 5).
Table 5. TE and CV for 0.4mm BGA Components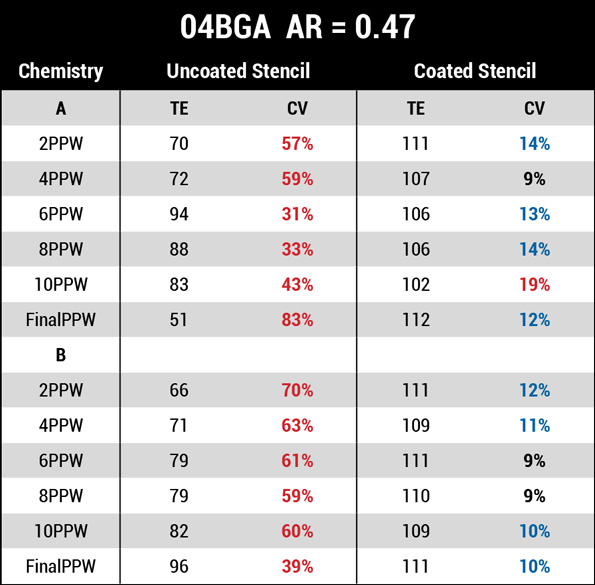
As anticipated, the uncoated stencil performed more poorly on the 0.47 AR than the 0.50 AR, in both TE and CV. The coated stencil, however, showed >100% TE and the CVs were in the 9-19% range, indicating the edge of the process window, and making it the most informative data set to further explore.
Based on the normal curve model shown in Figure 5, the CVs on uncoated stencils indicate complete incapability and would add statistical noise to the analysis. Therefore, the effects of uncoated stencils are eliminated from the analysis.
It should again be noted that the edge of the print process window was identified at the 04BGA pitch (0.4mm). indicating a very well set up process. Many print processes reach the edge of their window at the 05BGA pitch (0.5mm).
The leading-edge effect. The PCB layout for the 04BGAs is shown in Figure 6.
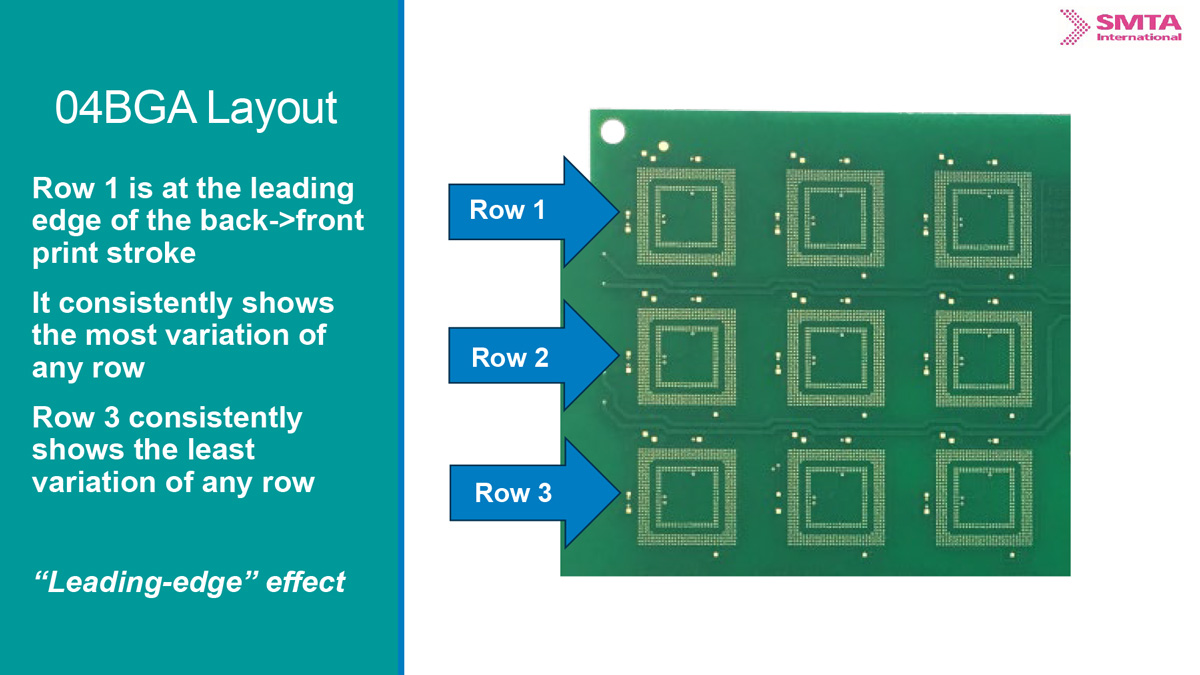
Figure 6. Close up of the layout of 0.4mm BGA on SMTA board.
Row 1 consistently shows the greatest amount of variation. In solder paste printing, this is often referred to as the “leading-edge effect.” It is typically observed when the first few apertures in the direction of the squeegee stroke do not get complete fill, and it is more common as aperture size decreases.
Row 3 consistently shows the least amount of variation. It is located in the middle part of the print stroke, where the solder paste has reached its lowest printing viscosity.
Figures 7 and 8 show the differences in print quality among the three rows. TEs in Row 1 are slightly lower than Rows 2 or 3 which appear to be relatively equal. The CVs on Row 1, however, are considerably higher than those of Rows 2 or 3. In fact, the CVs on Row 1 are so high that the process is not considered capable (<15%). Rows 2 and 3 provide better indicators on the effectiveness of under wiping.
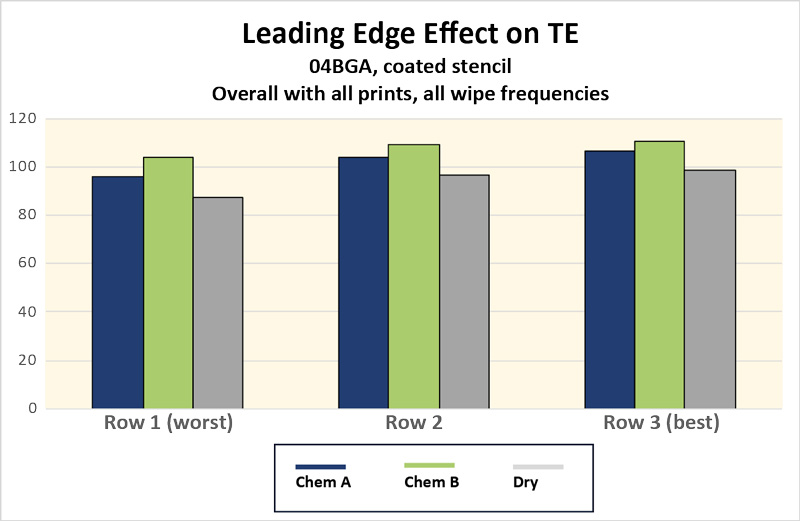
Figure 7. TE for top (row 1), middle (row 2) and bottom (row 3) rows of 0.4mm BGAs.
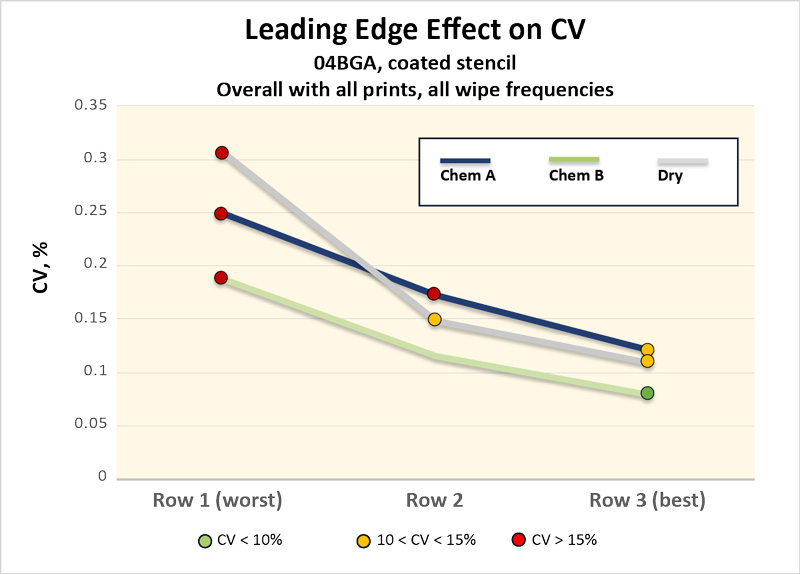
Figure 8. CV for top (row 1), middle (row 2) and bottom (row 3) rows of 0.4mm BGAs. *Indicates a square aperture with radiused corners.
Further quantification of the leading-edge effect is outside the scope of this study, but may become the subject of others. Data from the leading edge are excluded from further analysis.
Having identified the finest pitch partially capable and eliminated the noise introduced by the uncoated stencil and the leading-edge effect, the effects of the wipe on process capability can be more precisely gauged.
Overall transfer and variation for each wipe type. Each print stroke produces 3,720 data points. There are 620 apertures per component, and six components in the two rows analyzed. Each experiment had two replicates; therefore, the sample size for each stroke is 7440.
The first analysis method examines the overall TE and CV at different wipe intervals for all prints in that particular interval, e.g. two prints at two prints per wipe (PPW), four prints at four PPW, etc. The final PPW is actually the 31st print and is performed after the 30th print, or 10 PPW interval.
Results of the first analysis method can be viewed in Figures 9-11. Examining the data for groups as a whole, several inferences can be drawn:
- Chemistry B provides the most stable process, with TEs consistently above 100% and CVs less than 15%.
- Chemistry A also exhibits TEs above 100% but does not maintain CVs below 15% at the 10 PPW interval.
- Dry wipe almost reaches 100% TE but does not achieve it. Two CV points are greater than 15%, particularly the final PPW.
To better understand the impact of underwipe chemistry, the data was also analyzed by the print quality before and after each wipe. Results of this second analysis method provide more information on the immediate effects of underwipe as opposed to the overall effects.
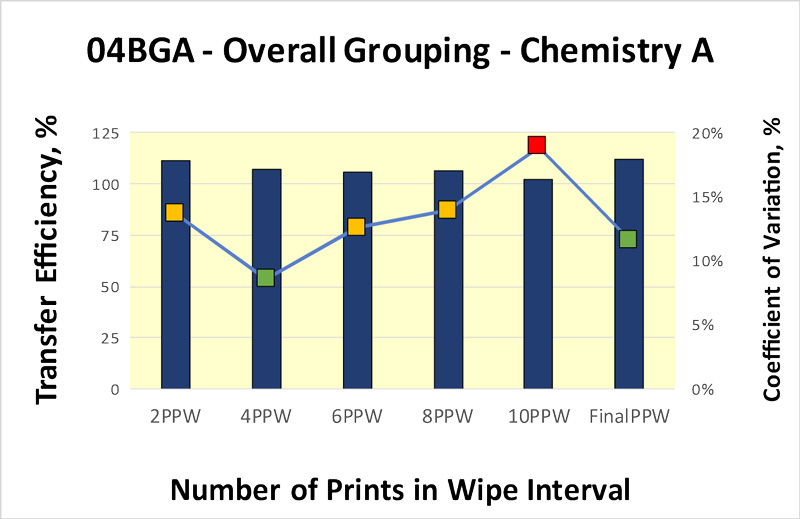
Figure 9. TE and CV at different wipe intervals.
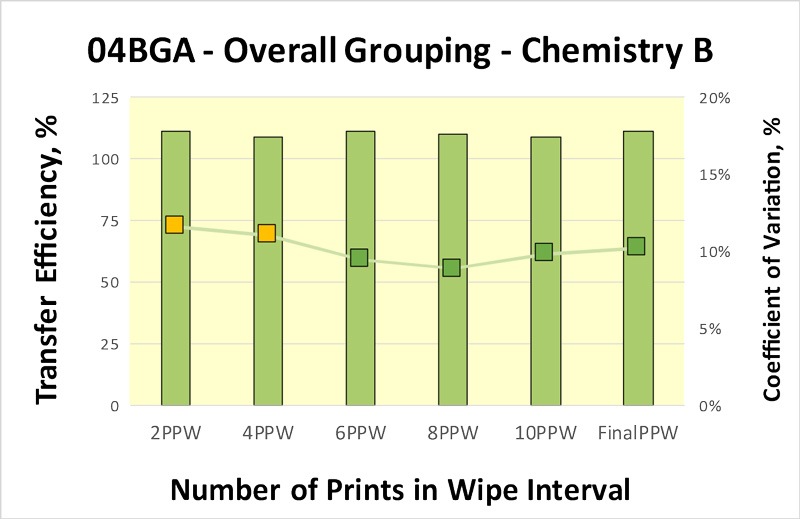
Figure 10. TE and CV at different wipe intervals.
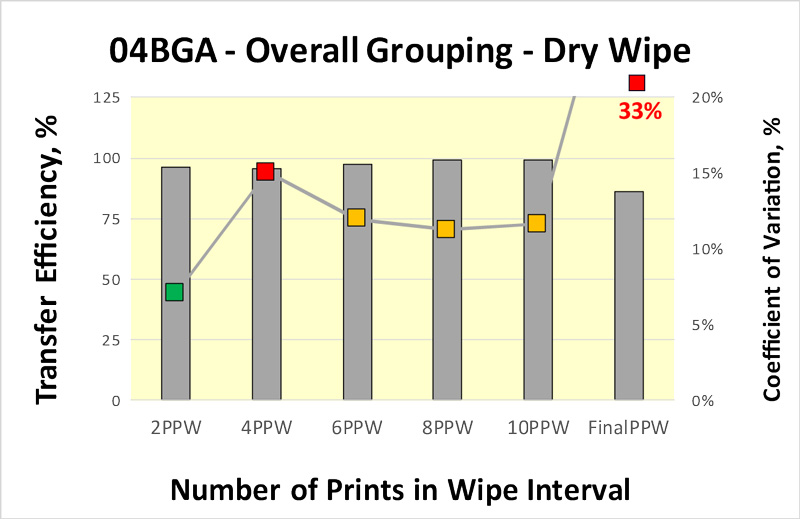
Figure 11. TE and CV at different wipe intervals.
Figures 12–14 take a closer look at what happens to the print process output when an underwipe is applied.
- Chemistry A appears very stable for pre-and post- wipe prints up to four PPW intervals. At six PPW and higher intervals, however, it appears less effective than Chemistry B.
- Chemistry B appears to trend in the opposite direction of Chemistry A. While its pre- and post-wipe prints are all of acceptable quality, the longer wipe intervals show better performance than the shorter ones.
- The dry wipe shows a repeatable pattern in CV: it is better before the wipe than after. Also, with the exception of the two PPW intervals, it shows a pattern of higher TE before the wipe and lower TE after it.
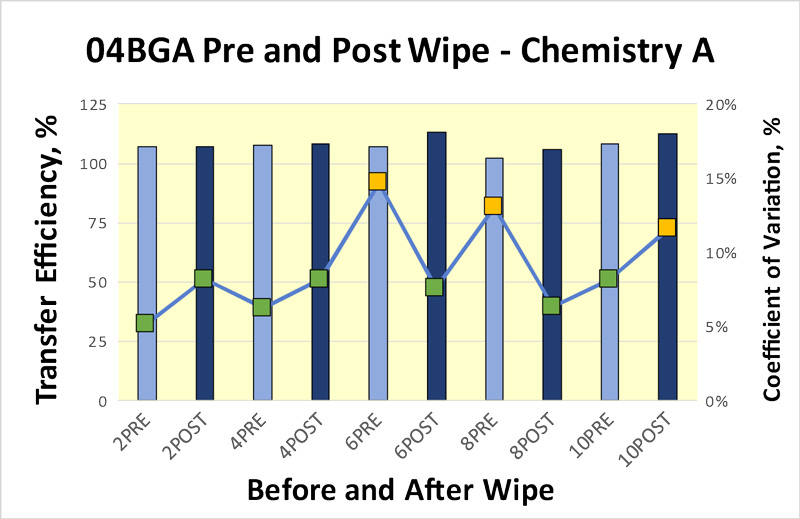
Figure 12. TE and CV before and after wipe.
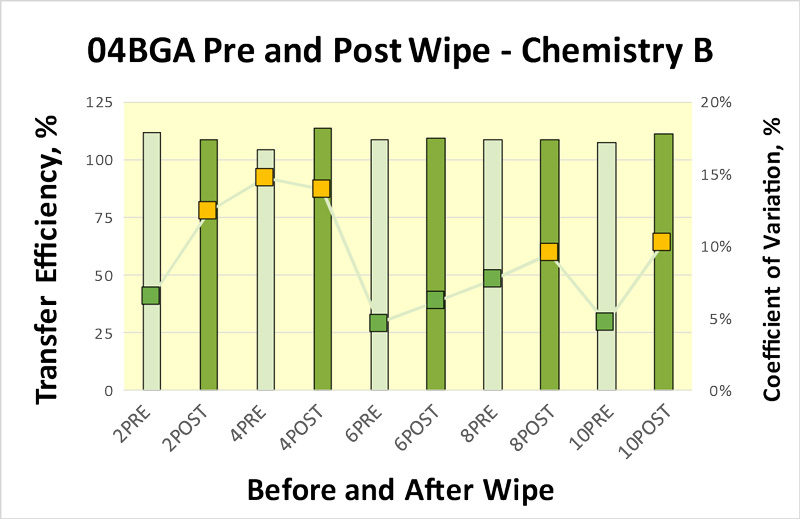
Figure 13. TE and CV before and after wipe.
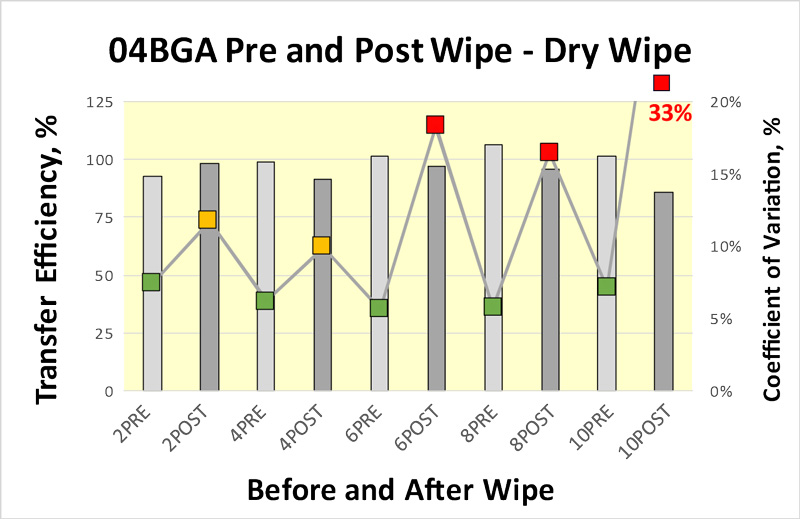
Figure 14. TE and CV before and after wipe.
Discussion and Conclusions
The print quality on these tests was remarkable compared to other production processes. This leads to conclusions that:
- Best practices are deployed throughout the process.
- Results from this study are not necessarily predictive of other production processes that are not as tightly controlled.
- Results from this study are comparable to those performed in laboratory environments rather than production environments.
- With the proper process controls and best practices in place, production environments can perform at the same quality level as laboratories.
The biggest contributor to print quality was coating the stencil with a surface-modifying coating. Stencil surface modifiers have been used for over a decade with well-documented improvements in print quality, especially at area ratios less than 0.60. It should be a given that apertures with 0.47 ARs do not get processed without a stencil coating.
The second-largest contributor was the position of the components relative to the print stroke. Apertures on the leading edge of the print stroke consistently displayed lower TE and higher CV than similar apertures later in the print stroke. Process engineers generally do not have influence over printed circuit board layout, and some printer manufacturers offer machine options to overcome leading-edge effect, including changing squeegee speed or angle as the squeegee position approaches the print area.
On apertures nearer the middle of the board, the variation due to the leading edge is minimized. Focusing on the apertures on the edge of the process window gains the most insight into the third-largest contributor: underwipe type. It further allows exploration within the wet type of wipe.
Wet wipe outperformed dry wipe in a manner similar to previous studies (results shown in Figures 15 and 16). It provided a consistent process in terms of TE throughout the different wipe intervals.
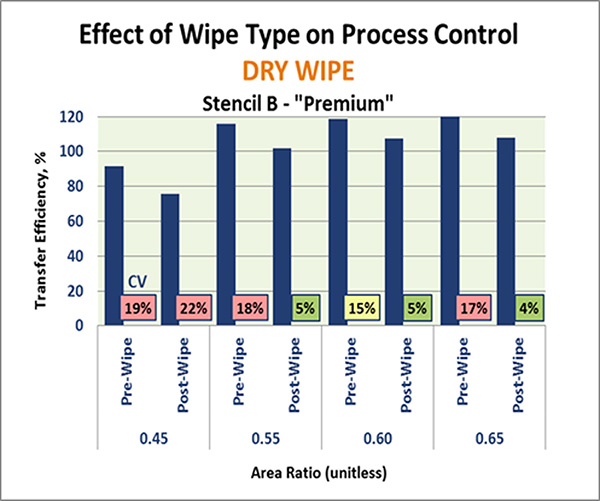
Figure 15. TE and CV with dry and wet wipe on coated stencil from 2016 study.5
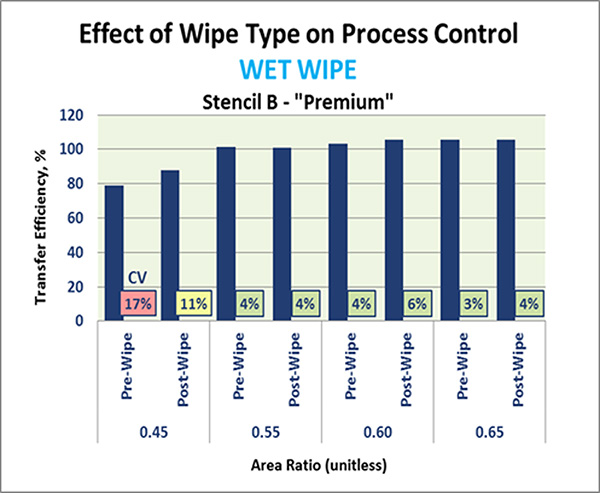
Figure 16. TE and CV with dry and wet wipe on coated stencil from 2016 study.5
The data in the figures show the results of a previous study5 using chemistry B and a different solder paste. The trend is again obvious: the process “bounces” with a dry wipe. The process is consistent with a wet wipe. Similar results were recorded in the same study with an uncoated stencil.
Both studies agree: Wet wipes remove more print variation than dry wipes. Dry wipes tend to show a cyclical pattern of out-of-control and in-control before and after the wipe, whereas wet wipes tend to keep the process steadier.
Of the two wet chemistries, different characteristics were observed:
- A performed better than B on shorter wipe intervals.
- B performed better than A on longer wipe intervals.
This difference in performance – seen in both types of analysis – indicates Chemistry A may dry faster than Chemistry B, but not clean this paste quite as effectively. Conversely, Chemistry B may dry more slowly than Chemistry A, but can clean this solder paste more effectively.
The perceived difference in cleaning and drying capability leads to the conclusion that in processes where frequent wipes are required, i.e. high aperture density and low ARs, Chemistry A would be a better choice for the process. By contrast, Chemistry B would be a better choice for lower density, coarser pitch, or wider boards that would benefit from the slower drying liquid and the longer wipe intervals.
Regardless of chemistry choice, wet wiping clearly improves print performance over dry wipes. The dry wipes show increasing TE prior to wipe, decreasing TE after wipe, and CVs dramatically increasing after the wipe. This is presumably because there is nothing to dilute the sticky paste flux, and dry wiping smears it on the bottom of the stencil (even coated stencils), as demonstrated in previous studies.
Non-conforming solder paste prints cost assemblers in a multitude of ways:
- The lowest cost of a poor print is that of labor: cleaning the bare PCB, drying it and rerunning it.
- The next level of incurred cost is the touch-up or repair labor at the end of the assembly line.
- The cost of repair grows even more if it is found at test, which carries very high overhead expenses.
- The worst cost impact is when the joint fails in service and the PCB must be replaced.
SMT manufacturing is both a cost-conscious and quality-conscious business. Considerations include assembly performance class, projected lifetime, upfront investments, material costs, production costs, repair costs and brand equity. Each assembly operation is unique and has different factors influencing its manufacturing strategy. Systemic defect prevention can often be more economical than specific, after-the-fact remedies.
References
- Chrys Shea, Mike Bixenman, Debbie Carboni, Brook Sandy-Smith, Greg Wade, Ray Whittier, Joe Perault, and Eric Hanson, “Quantifying the Improvements in the Solder Paste Printing Process from Stencil Nanocoatings and Engineered Under Wipe Solvents,” International Conference on Soldering & Reliability, 2014.
- Mike Bixenman, D.B.A., Wayne Raney, Chrys Shea, and Ray Whittier, “Understencil Video Effects to Study Solder Paste Transfer and Wiping Effects,” Proceedings of SMTA International, 2014.
- Chrys Shea, Mike Bixenman, D.B.A., Wayne Raney, and Ray Whittier, “Video Analysis of Solder Paste Release from Stencils,” Proceedings of SMTA International, 2015.
- Chrys Shea, Mike Bixenman, D.B.A., and Wayne Raney, “Video Analysis of Solder Paste Release from Stencils, Part III,” Proceedings of SMTA International, 2016.
- Chrys Shea, “Research for Improvement in Transfer Efficiency Coatings on Stencils,” IPC High Reliability Cleaning and Coating Conference, October 2016.
Ed: This article was first published in the Proceedings of SMTA International, October 2023 and is reprinted here with permission of the authors.
is founder of Shea Engineering Services (sheaengineering.com); chrys@sheaengineering.com. is vice president, sales at Kyzen (kyzen.com); debbie_carboni@kyzen.com. is senior process engineer at Garmin International (garmin.com).
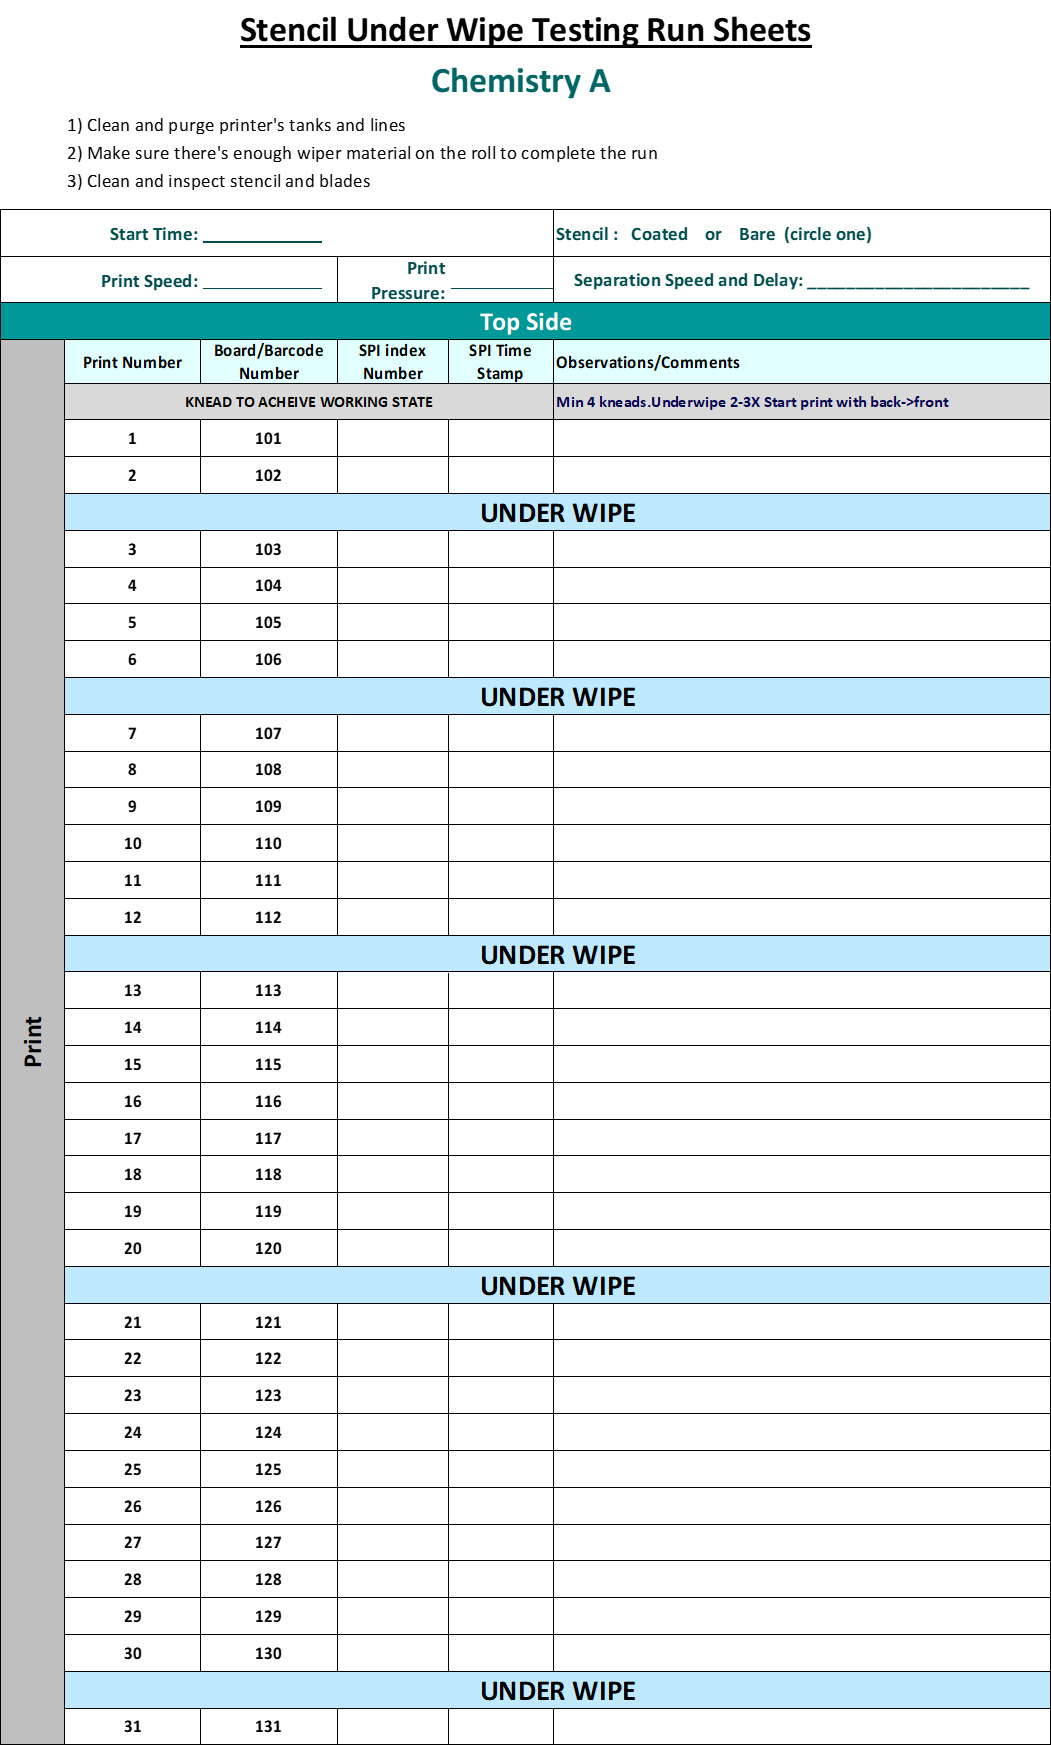
Appendix A – DOE Execution Step-by-Step Directions


Press Releases
- Altus Group Invests in Major Headquarters Expansion to Showcase Complete Turnkey Manufacturing Capability
- ViTrox Americas Welcomes Eric Cruz as Technical Support Engineer
- ECD Strengthens Engineering Team with New Software Development Hire
- ViTrox Americas Welcomes Doug Ennis as Senior Field Applications & Service Engineer