

Automating Detection of Pick-and-Place Nozzle Anomalies (An IIoT Case Study)
Tools to identify anomalies, and trends for reducing downtime and defects while driving operations productivity.
In the SMT pick-and-place operation, components in tape or tray are vacuum picked and placed in solder paste on a PCB location. An optical inspection step takes PCB images to detect the components’ centroid and other possible displacements. Nozzles are mounted to spindles contained within a head that moves at high speed. The equipment in this study can use up to 30 nozzles per head and may have one to four heads per machine. Nozzle vacuum degradation (from clogging, tip wear or mechanical issue) increases the likelihood to mis-pick components and increases the potential of an end-of-line defect. The challenge is to leverage the knowledge extracted during this operation to learn potential defects and other tendencies.
To manage the pick-and-place process, operators monitor the machines using machine management data that conveys process information such as feeder, component and nozzle reject percentages and total rejected counts over the course of a production run. These metrics, coupled with machine utilization, allow operators to identify a component pick or inspection problem that requires domain-expertise support for troubleshooting.
In addition to monitoring each production run, weekly mis-pick and reject parts per million (PPM) data are used to monitor each electronic assembly plant over time, shown in a control chart. When a shift or out-of-control point is discovered, it is investigated for root cause and corrective action. These actions have helped improve pick performance 43% over five years.
Some out-of-control events were traced to a problem with an individual nozzle or spindle on the pick-and-place machine. Machine operators didn’t detect these events. As a nozzle starts to clog or fail, it tends to mis-pick components. As this error rate increases, it can cause downtime and reduce efficiency. By detecting or predicting degradation of the nozzles, the anomaly alerting is provided to support personnel to proactively troubleshoot the nozzle before it becomes a significant problem.
One goal is to control downtime by anticipating nozzle failure based on factual calculations. A second is to reduce false alarming to avoid overwhelming the operators and support staff.
Solution Overview
Analytics overview. Manufacturers desire to transform their processes from reacting to predicting a downtime problem. This progression is described below:
- Descriptive: Most solutions today are around descriptive analytics, with charts, reports, trends, etc. These are good examples of descriptive analytics; they tend to be “rearview mirror” systems that describe what has happened.
- Diagnostic: These types of analytics focus on “why” things happened and try to get to the root cause of why issues occurred.
- Predictive: A system that alerts a user of what will happen. Predictive maintenance use case is where the system uses advanced machine-learning techniques to look at historical data (downtime tracking and process historical data) to then predict failures on assets by finding the “signature” of what happens before a failure (using the history) and then looking for that “signature” to happen again.
- Prescriptive: This is one of the most advanced analytical techniques. The system can go so far as to help determine what the manufacturer should do, and even do it for them, if they choose.
Pick-and-place dashboard.1 A descriptive-analytic-based solution was initially built to establish a platform for visualizing the behavior of the machine, nozzle and process per work order (FIGURE 1). Based on this knowledge, the team was able to define a predictive monitoring algorithm, which required a high-performance computing workbench with AI helpers and parallel data processing engines.
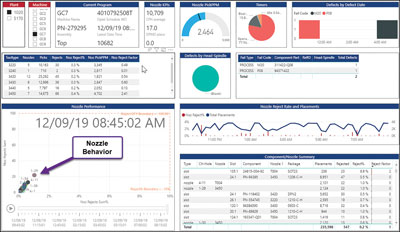 Figure 1. Descriptive analytics machine nozzle performance dashboard.
Governance of data flows, security, and data preparation were fundamental for achieving a clear view of the performance. A significant amount of time was required to establish an understanding of good data versus noise.
The pick-and-place data are configured to refresh every 15 min. Each segment of data is moved to a data lake in the cloud via a plant-floor gateway. The data lake was built using big data components such as Hadoop, Spark and Kafka. In the data lake environment, micro services were created to handle data governance, ETL and analytics. Classical data wrangling and data transformation (supported spark-based services) were accomplished in the data lake level. A separate folder will host the curated data for further model development. Power BI was used to visualize the data.
The team collected operator experience into the design of the predictive solution. Interviews with the operators provided insights about other aspects that affect pick-and-place performance.
It was discovered instantaneous measurements were not enough to unveil the anomalies causing defects. We learned the nozzle position relative to its cumulative rejects is an important indicator. This insight led the team to think in the direction of an AI-based algorithm that could learn and trace the behavior of individual nozzles (FIGURE 2).
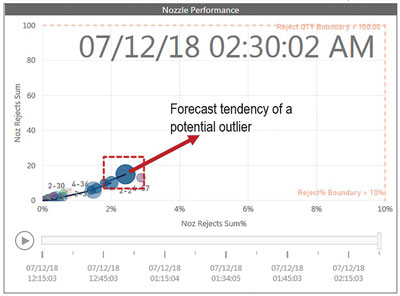 Figure 2. Illustration of nozzle performance trajectory.
Feedback from the support technicians using the visualization dashboard indicated they would prefer to be notified when a nozzle is out of control instead of monitoring a dashboard.
Anomaly detection/prediction.1 Collaboration with third-party software solutions was explored to understand if machine-learning techniques could be used to forecast nozzle performance. Mis-pick and reject performance can be erratic over time due to feeder exhaustion. Also, pick-and-place machines can automatically correct pick alignment over time. Such conditions can cause a spike in poor performance. Due to these inconsistencies, forecasting algorithms tended to flag a change in the process that was either a feeder that needed replenishment or a feeder the machine had the ability to self-correct. These false positives led us to consider other approaches.
Focusing on instances where a technician should have been dispatched to troubleshoot the machine, the behavior of nozzles was studied, as referenced in FIGURES 3 to 6. An idea was conceived to track performance of each nozzle over time and assign a score that would accumulate to a trigger value, indicating when technical support is required.
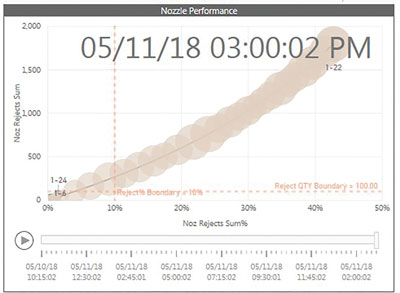 Figure 3. Nozzle 1-22 track, where nozzle percentage and sum increased each period over the 3.75-hr. work order.
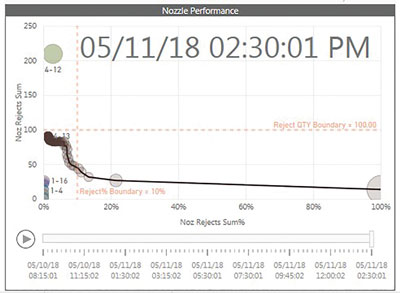 Figure 4. Nozzle 4-13 track, where first period had 100% rejects then dropped, but rejects continued to accumulate at slow rate over 6.25-hr. work order.
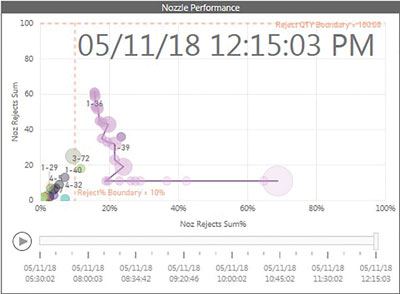 Figure 5. Nozzle 1-36 track, where the machine had the first period reject rate as ~70% and 10 rejects that were overcome; no additional rejects occurred for the next 10 periods and then held steady, and rejects started to occur over 6.75-hour work order.
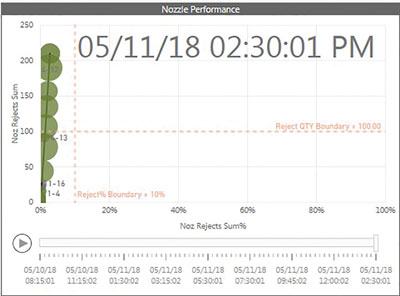 Figure 6. Nozzle 4-12 track steadily increases over successive periods to ~210 rejects and 4% over 6.25-hour work order.
The Nozzle Performance “Bubble” Chart plots the incremental position of each nozzle over segments of time of the work order. The x-axis is the nozzle reject sum percentage by time, and the y-axis is the nozzle reject sum representing the accumulated sum of rejects over the entire work order. Nozzle reject percentage can increase and decrease throughout the work order and can move left and right in the chart, while nozzle reject sum can only stay the same or increase. Connecting these periods helps show if the machine is trending out of control (i.e., up to the right), improving (where the trend is moving straight left), or somewhere in between (where the nozzle reject percentage may stay the same or is slowly decreasing, but the nozzle reject sum continues to increase over time).
Constants were assigned for each nozzle’s movement relative to the previous position of the nozzle in time (FIGURE 7). C1 to C5 are vectors relative to the severity of a movement in that direction summed over consecutive time periods. The vector states or slopes between consecutive points in time are assessed. A constant is assigned and accumulates in what is called a nozzle score; C1 to C3 are set to +1.0, C4 is +0.33 and C5 is -2.0. Each constant C1 to C5 is independent and can be assigned individual values. The nozzle score cannot be less than zero.
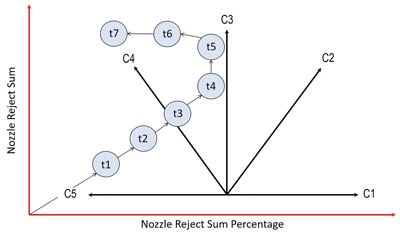 Figure 7. Illustration of constants relative to the successive time periods (t1 – t7) of the nozzle performance.
A trigger value is associated with the accumulated nozzle score of 5. Coupled with the nozzle score exceeding the trigger value, additional logic is checked to ensure the nozzle performance position is greater than or equal to X nozzle reject percentage (i.e., 10%) or greater than or equal to Y nozzle reject sum (i.e., 50). When this condition is satisfied, the anomaly detection system generates an alert that is routed to support personnel, notifying them via text or email with the machine name, nozzle location, nozzle type, and current performance statistics.
The vectors C1 to C5, trigger value, and additional logic that the current performance is equal to or greater than X (nozzle reject percentage) or Y (nozzle reject sum) can be changed to adjust the sensitivity to manage the rate of alarms to avoid overwhelming the support staff.
IIoT architecture. The anomaly detection algorithm is deployed on an industrial edge level device in a docker container. A container is an OS-level virtualization to deliver software packages. Containers are isolated from each other and bundled with their own software, libraries and configuration files; they can communicate with each other through well-defined channels. All containers are executed by a single operating-system kernel and are lighter weight than virtual machines.
As pick-and-place data stream through the gateway into the edge device, each nozzle score is calculated, and alerts are generated if the criteria are met and routed in near real-time to support personnel. The current nozzle scores are saved in memory until new data arrive. This has eliminated the 15 to 30 min. latency seen with cloud-level analytic dashboards. Long term, processing data at the edge may enable less data to be transmitted to the cloud, reducing the overhead of managing cloud storage.
Mobile user app. A pilot mobile app was created that enables the user to observe plant, machine and nozzle performance summaries (FIGURE 8). For nozzles that receive an alert, a forecasting algorithm is used to predict the performance of the nozzle four periods into the future if action is not taken.
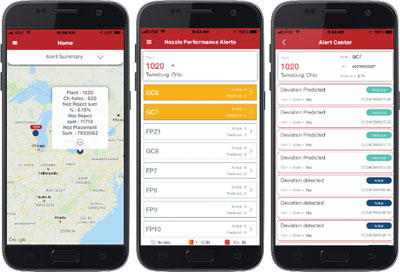 Figure 8. Nozzle Mobile App screens for plant summary, machine summary and machine nozzle alert list.
Solution Impact
The ability to add anomaly detection to the existing information has added visibility and priority, while eliminating the necessity to manually look and analyze issues. This was achieved by the anomaly algorithm and automatic notifications. The dashboard provides the ability to further assess nozzle behavior and trends should they need to be referenced by the support staff. This enables the support staff to respond prepared with the relevant information to what needs troubleshot and with the replacement parts in-hand. Typical process downtime to troubleshoot and repair a nozzle, feeder or inspection problem takes 45 min. With this information, this time is reduced to 15 min. or less.
A pick-and-place machine experiencing a pick or inspection problem impacts the productivity of the SMT line. If the machine experiencing the problem is the constraint machine, it impacts the overall flow of product through the line, reducing operating efficiencies. We have observed impacts as great as 35% reduction in CPH and line throughput.
When a machine is experiencing a pick problem, it has the potential to increase end-of-line defects, especially if the root cause of the problem is vacuum-related and the component is not held securely on the nozzle tip over the pick-and-placement cycle.
Conclusion
Manufacturers are challenged to improve productivity of their manufacturing lines. Improving the detection of a problem and reacting to it sooner eliminates wasted motion in the machine, improves flow of product on a line, reduces component scrap and can improve quality of product being produced. The Anomaly Detection Algorithm and the Nozzle Monitor Dashboard combined alert support staff to opportunities sooner than traditional methods of manual detection and reduce the chance of misdiagnosis.
Storing historical data in the data lake, along with other design and process data, provides other benefits. We have established other dashboards to analyze trends, as well as optimization and configuration opportunities. This minimizes the non-value-add time an engineer spends mining and contextualizing data and provides insight into opportunities in minutes.
Reference
1. Patent pending.
Ed.: This article was originally published in the SMTA International Proceedings and is printed here with permission of the authors.
is senior project engineer, is senior principal engineer and is senior process engineer at Rockwell Automation (rockwellautomation.com); gjvance@ra.rockwell.com.


Press Releases
- Seika Machinery’s SMI 2026 Webinar Series Continues with Focus on PCB Cleaning Before Solder Paste Printing
- Forwessun Expands Testing Capabilities through Strategic TRI Alliance
- Federal Electronics Expands Advanced Manufacturing Capabilities to Support Military and Aerospace Cable Assembly and Wire Harness Programs
- Altus Continues Irish Growth with Expansion of Engineering Team