

Cleanliness Assessment for Class III Lead-Free No-Clean Assemblies
Using IPC standards, a study identifies and qualifies an aqueous cleaning process capable of removing combinations of no-clean flux residues for high-rel boards.
In this study, a global contract manufacturer received a contract to manufacture Class III devices for a large medical OEM. Since these products are manufactured with no-clean flux, the OEM requested extensive testing, evaluation and validation to confirm that the selected cleaning process is capable of removing all flux residues and thereby ensuring the long-term integrity and reliability required of Class III products.
Based on the OEM’s product requirement, a DoE was developed and executed in two phases. The initial cleaning trials were conducted at the Zestron Technical Center employing spray-in-air cleaning equipment similar to one available at the EMS. Analytical analyses were conducted at Zestron, the EMS and several independent laboratories. Test vehicles used were EMS boards and IPC coupons. All necessary ESD precautions were followed throughout this study.
During Phase 1 of the DoE, visual inspection and ionic contamination analyses were conducted at Zestron as the optimum inline cleaner operating parameters were developed. Once the optimized cleaning parameters were identified, Phase 2 was executed. IC and SEC tests were completed using the EMS boards validating the recommended cleaning parameters identified in Phase 1. The IC test was conducted at a certified laboratory and the SEC test at the EMS location. For Phase 2, SIR and ECM analyses were also conducted at a certified laboratory using IPC test coupons. Finally, compatibility testing was performed with the selected cleaning agent with all critical assembly components and materials.
Following the successful execution of the DoE, the recommended cleaning process was implemented at the OEM site, and the cleaning results were validated.
Table 1. Board Categorization by Paste and Flux Type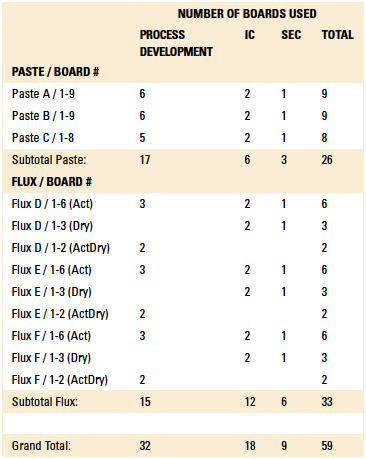
Methodology. The EMS uses six (three each) solder pastes and wave fluxes within its manufacturing process and cleans all PCBs through an inline spray-in-air cleaner. Thus, for this study, the six solder pastes and liquid fluxes used were identified as Solder Paste A (leaded no-clean), Solder Paste B (lead-free no-clean), Solder Paste C (no-clean tacky flux), Wave Flux D (no-clean leaded process), Wave Flux E (no-clean lead-free process) and Wave Flux F (no-clean lead-free process).
Upon considering wave flux process options within the DoE, the EMS requested for the cleaning process parameters for dried flux (flux only) and activated flux (flux and solder) to be identified. Thus, boards were prepared with activated flux, dried flux and a combination of activated and dried flux. Although cleaning parameters were optimized for all combinations and verified using IC and SEC analyses, cleaning parameters for the activated and dried flux boards (labeled as ActDry) were considered the most challenging and therefore used as the basis for recommending optimal inline cleaning parameters.
Wave solder fluxes were classified as:
- Activated flux (labeled as Act).
- Dried flux (labeled as Dry).
- Activated and dried flux (labeled as ActDry).
Prior to executing Phase 1 of the DoE, an aqueous cleaning agent was selected on the basis of its ability to solubilize the selected pastes and fluxes, as well as its compatibility with the application cleaning equipment. As a result of this analysis, a micro phase cleaning agent, identified as Cleaning Agent A, was selected for all the cleaning trials within this DoE.
Phase 1: Test protocol. The EMS initially provided 59 test boards for use in the initial DoE. The boards were categorized by paste and flux type. Of these, 32 boards were used to determine optimum wash settings for the inline cleaner, including cleaning agent concentration, wash temperature and wash exposure time. Initial cleanliness assessments were made using visual inspection and ionic contamination analysis.
Visual inspection was conducted according to IPC-A-610E.1 Ionic contamination analysis was conducted using test equipment with a 75% solution IPA in DI-water in accordance with the IPC-TM-650 Method 2.3.25.2 This evaluation was based on J-STD-001E.3
Initial cleaning trials and visual inspection and ionic contamination analyses were conducted at Zestron, since this location had the same cleaning equipment as the contract manufacturer site.
Of the 59 boards provided by the EMS, they were categorized and processed as follows: Twenty-six boards were reflowed using the three solder paste varieties, with 17 used for defining inline process parameters, six used for ion chromatography analysis, and three used for SEC analysis. Thirty-three boards were soldered with the three wave flux varieties, with 15 used for defining inline process parameters, 12 used for ion chromatography analysis, and six used for SEC analysis.
Results Discussion
Phase 1: Cleaning process. During the process development trials using the initial 32 boards, the cleaning agent concentration, wash temperature and inline conveyor belt speed were varied and results recorded (Table 2). At the conclusion of each trial with each board type, visual inspection and ionic contamination analyses were performed to assess board cleanliness until the optimum inline cleaner operating parameters were identified.
Table 2. Cleaning Process Initial Parameters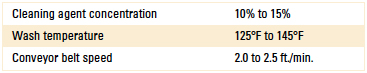
Phase I: Cleaning process results. The inline cleaner process parameters evaluated, as well as the ionic contamination test results, are detailed in Table 3 and Table 4. The operating parameters yielding the lowest ionic contamination value for each solder and flux type are highlighted in each table. For this analysis, the ionic contamination threshold was set at 10.06µg/in2.
Table 3. Cleaning Results of the Post-Reflow Boards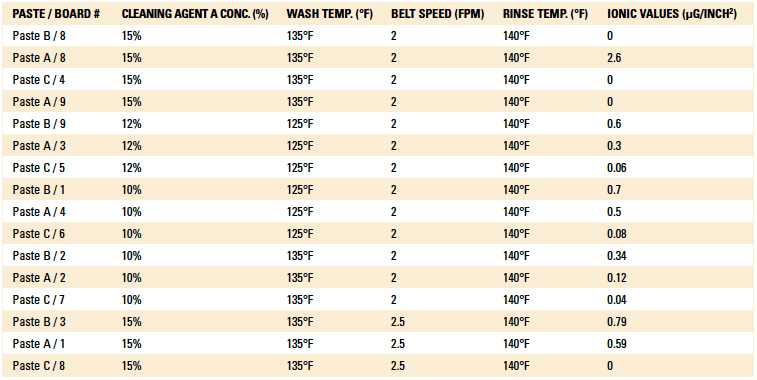
Table 4. Cleaning Results of the Post Wave-Solder Boards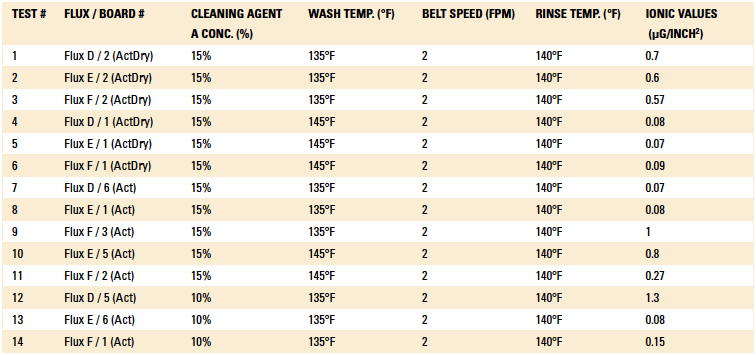
Figures 1 to 6 show the solder paste substrates before and after cleaning. Figures 7 to 12 show the wave flux substrates before and after cleaning.
Figure 1. Paste A before cleaning.
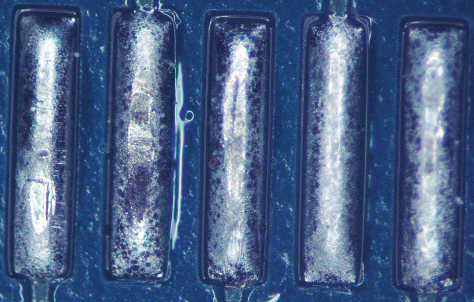
Figure 2. Paste A after cleaning.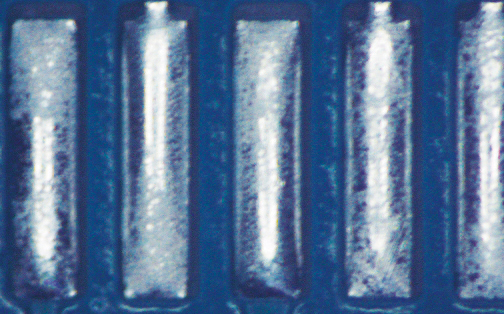
Figure 3. Paste B before cleaning.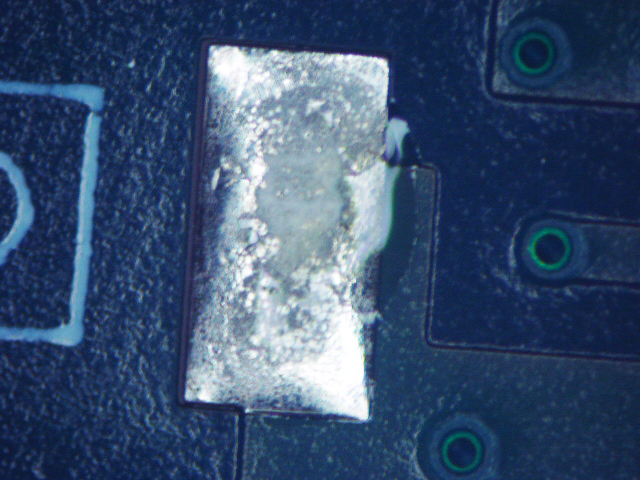
Figure 4. Paste B after cleaning.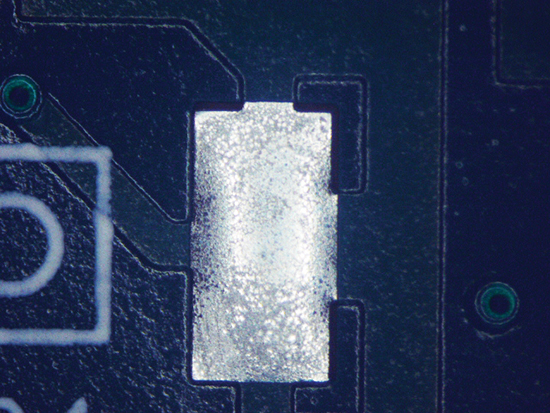
Figure 5. Paste C before cleaning.
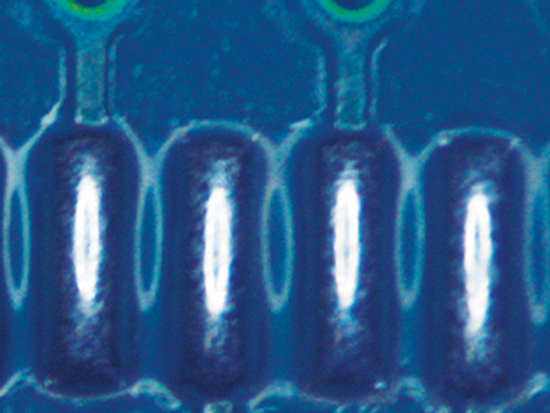
Figure 6. Paste C after cleaning.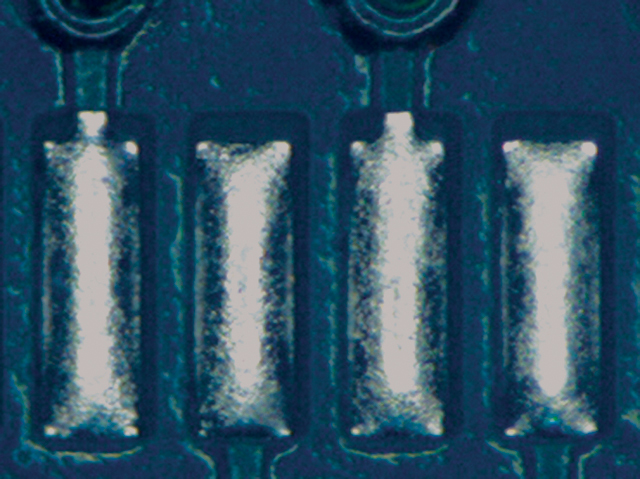
Figure 7. Wave Flux D (ActDry) before cleaning.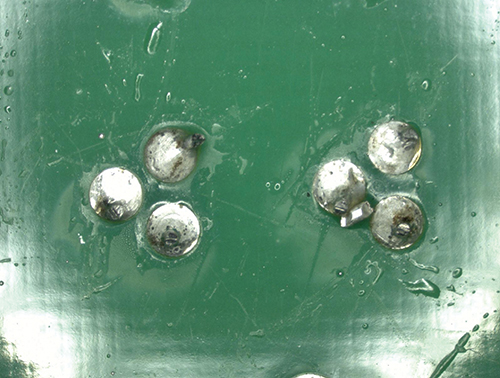
Figure 8. Wave Flux D after cleaning.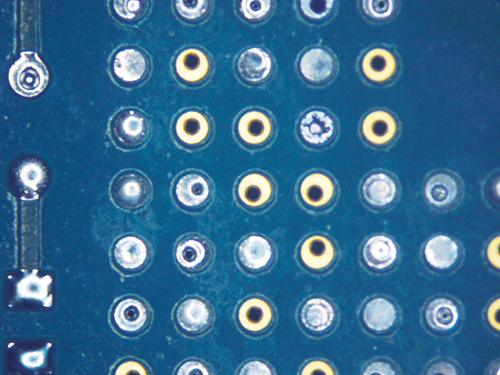
Figure 9. Wave Flux E (ActDry) before cleaning.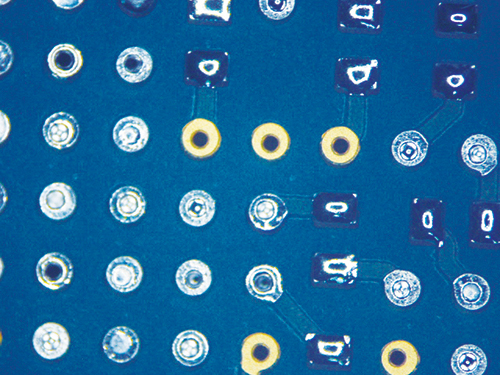
Figure 10. Wave Flux E (ActDry) after cleaning.
Figure 11. Wave Flux F (ActDry) before cleaning.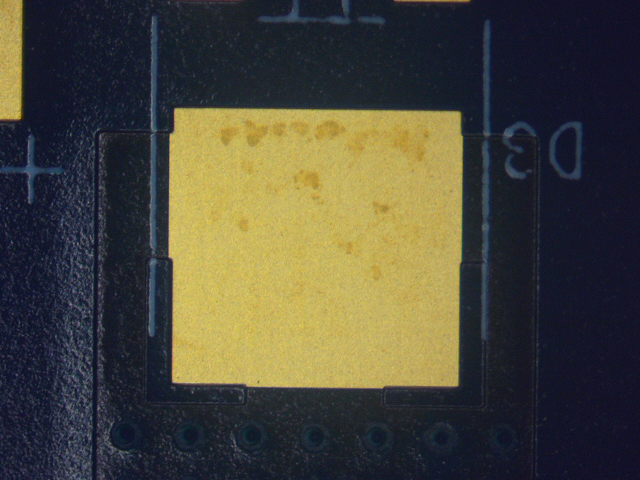
Figure 12. Wave Flux F (ActDry) after cleaning.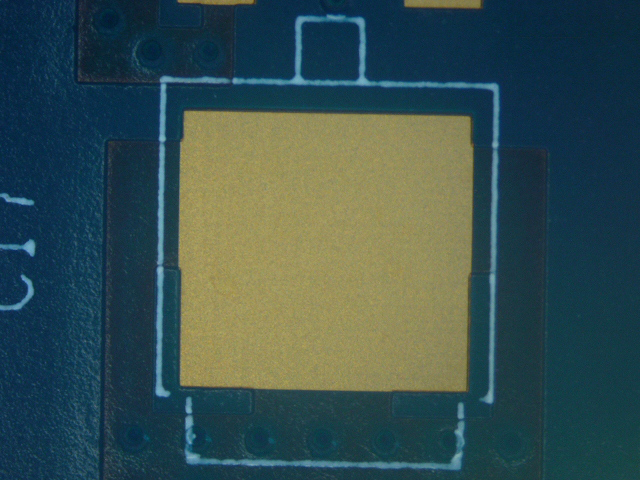
Phase 1: Cleaning process results summary. Through the process development phase of this study, the authors identified the optimum cleaning parameters required to fully remove all post-soldered flux residues. However, since the EMC was seeking a single process condition capable of cleaning all flux residues, the authors used these test data as the basis for the optimum process recommendation. These optimized cleaning process parameters were then employed throughout the remainder of the DoE. These findings are detailed in Table 5.
Table 5. Optimum Inline Cleaning Process Parameters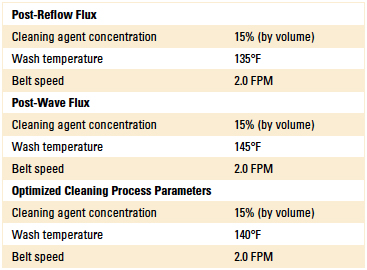
Phase 2: Test protocol. To further validate the cleanliness results of the parameters identified in Table 5, SIR and ECM analyses were performed using IPC test coupons. Following these tests, compatibility testing with critical components and materials was also performed using the selected cleaning agent.
Regarding the SIR and ECM tests, 18 IPC B-24 and nine IPC B-25A test coupons were sourced, incorporating the matrix of paste and flux types required. Additionally, control coupons were included in order to confirm the accuracy of the tests. Excluding the control coupons, all were cleaned using the optimized cleaning parameters identified in Table 5. Once cleaned, all boards were sent to an independent laboratory for analysis. SIR tests were conducted per J-STD-004B4 and IPC-TM-650, Method 2.6.3.70.5 ECM tests were conducted per J-STD-004A6 and IPC-TM-650, Method 2.6.14.1.7
Regarding material compatibility, separate tests were conducted using the EMS label material, as well as a variety of critical components. For label compatibility trials, two label types were evaluated: one used exclusively in the lead-free process and the other in the leaded process. The labels were passed through the inline cleaner five times using Cleaning Agent A (15% concentration) at 140°F and 2.0 ft/min. As part of these trials, the labels were examined for adhesive and ink removal after each inline pass.
Material compatibility testing included short-term and long-term tests. For the short-term test, critical components were subjected to Cleaning Agent A at a concentration of 30% and 140°F for 15 min. in a beaker placed on a hot plate with a magnetic stirrer. Upon inspection following the test, if the part was not compromised, the beaker test was extended to 24 hr. as part of the long-term compatibility testing.
In additional to the beaker tests, the critical components were also passed through the inline cleaner five times with the cleaning agent concentration at 15% and
140°F, yielding a total exposure time of 13 min. The parts were then inspected for dimensional and cosmetic changes. The components subjected to material compatibility testing are detailed in Table 6. Separate material compatibility tests were conducted using the EMC label material, as well as a variety of critical components.
Table 6. Components for Compatibility Testing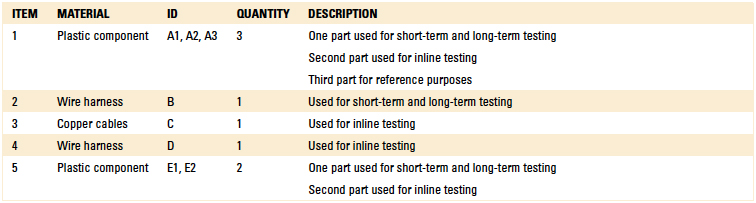
Phase 2: Ion chromatography results. For this test, 18 EMS boards as referenced in Table 1 were cleaned using the optimized parameters detailed in Table 5 and sent to an independent analytical laboratory for analysis.
The boards were divided into three groups consisting of six samples each. These were activated flux samples, dried flux samples and solder paste samples. Ion chromatography testing was conducted per IPC-TM-650, Method 2.3.28A.8 Results are detailed in Tables 7, 8 and 9.
Table 7. Ion Chromatography Results – Solder Paste Samples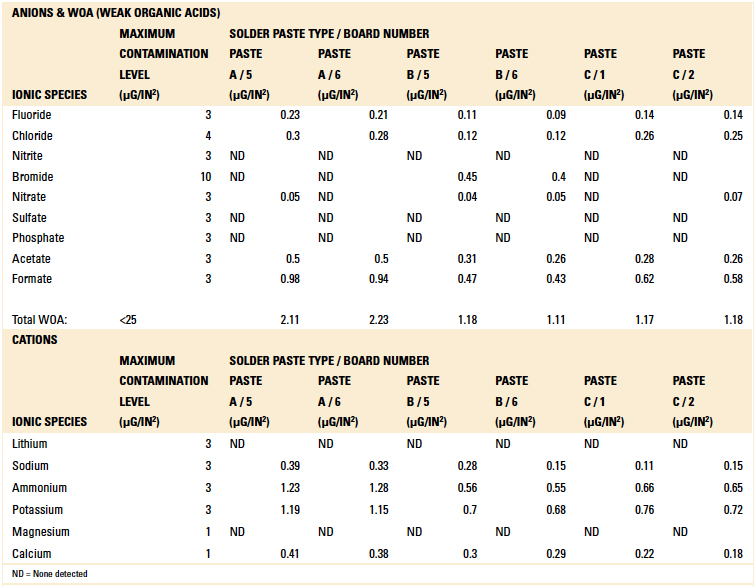
Table 8. Ion Chromatography Results – Activated Flux Samples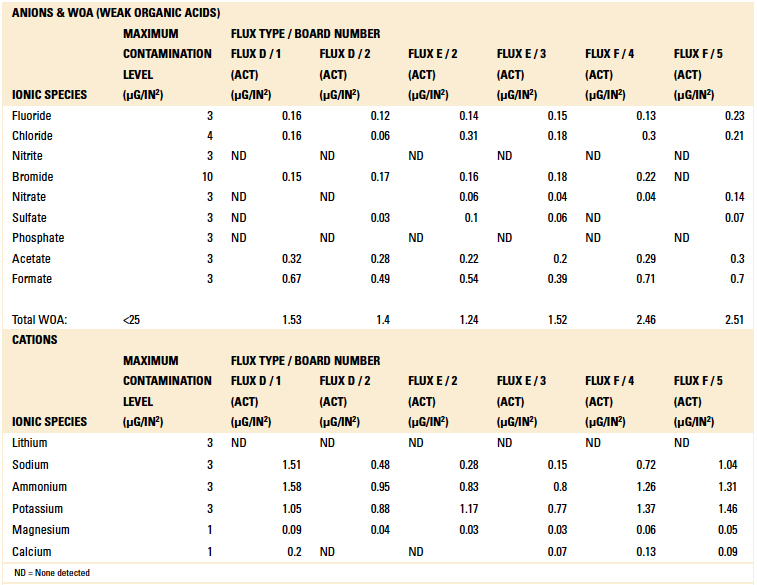
Table 9. Ion Chromatography Results – Dried Flux Samples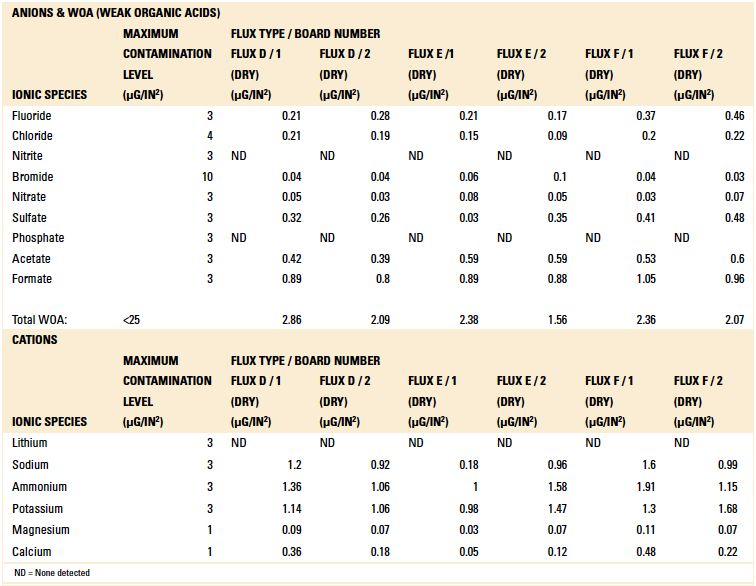
Based on the authors’ experience with this test methodology, the maximum contamination level for all ionic species is indicated within each table. As can be seen, the contamination level determined in all tests was found to be well below the acceptable limit.
Phase 2: SEC results. For this test, nine EMC boards as referenced in Table 1 were cleaned using the optimized parameters detailed in Table 5 and returned to the EMC for SEC analysis per J-STD-001E. SEC test results are detailed in Table 10.
Table 10. SEC Results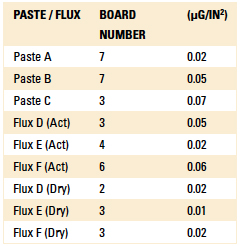
All values obtained from the SEC tests as well as ion chromatography were well below the specifications set forth by the EMS.
Phase 2: SIR and ECM results. For all wave flux types, SIR and ECM tests were conducted on both the act and dry test coupons only. With regard to the SIR analysis (7 day, 85°C/85% RH), all test coupons met the minimum requirement (>108). With regard to the ECM analysis (500 hr., 65°C, 85% RH), all test coupons met the minimum requirement (Final>Initial/10).
Figures 13 to 21 show SIR test results for all pastes and wave fluxes, while Figures 22 to 30 show the ECM test results for all pastes and wave fluxes.
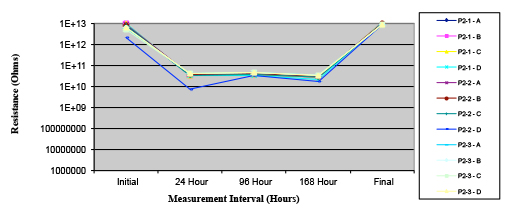
Figure 13. Paste A.
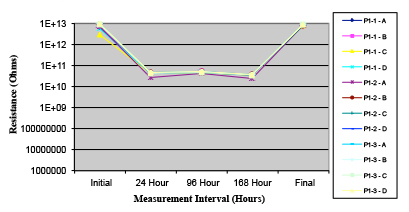
Figure 14. Paste B.
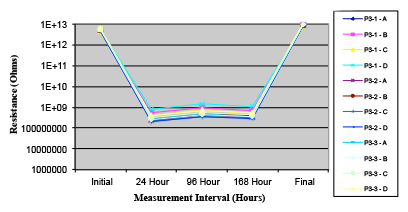
Figure 15. Paste C.
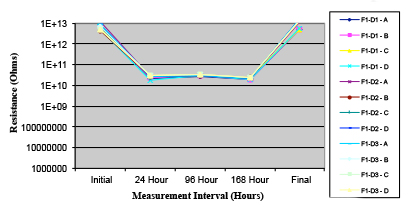
Figure 16. Wave Flux D – activated.
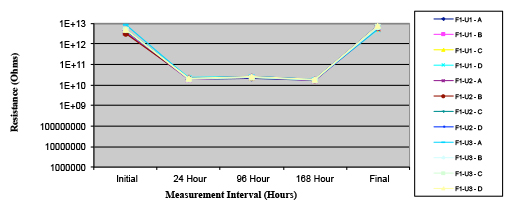
Figure 17. Wave Flux D – dried.
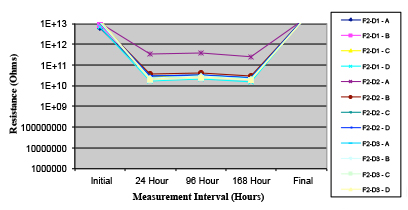
Figure 18. Wave Flux E – activated.
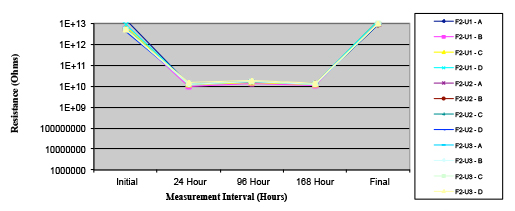
Figure 19. Wave Flux E – dried.
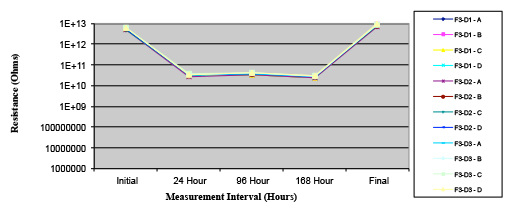
Figure 20. Wave Flux F – activated.
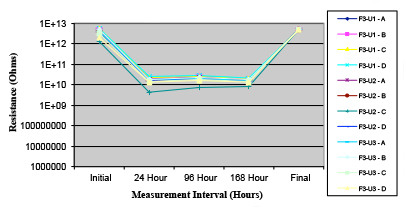
Figure 21. Wave Flux F – dried.
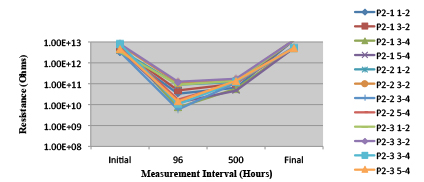
Figure 22. Paste A. Minimum requirement: 2.75E+09 (Pass)
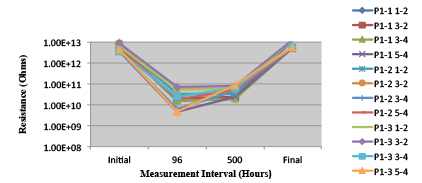
Figure 23. Paste B. Minimum requirement: 1.88E+09 (Pass)
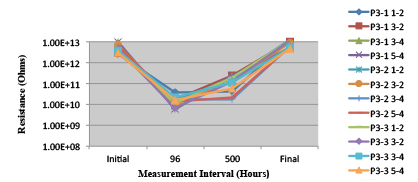
Figure 24. Paste C Minimum requirement: 1.33E+09 (Pass)
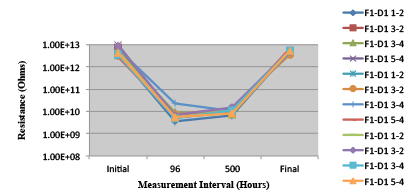
Figure 25. Wave Flux D - Activated. Minimum requirement: 6.41E+08 (Pass)
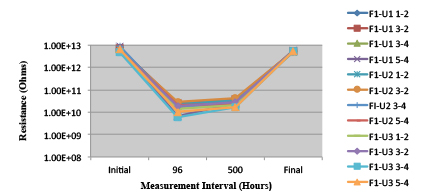
Figure 26. Wave Flux D – Dried. Minimum requirement: 1.57E+09 (Pass)
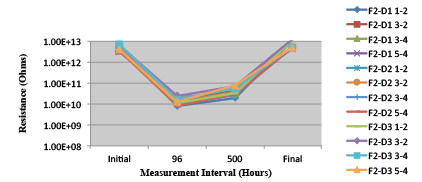
Figure 27. Wave Flux E – Activated. Minimum requirement: 1.32E+09 (Pass)
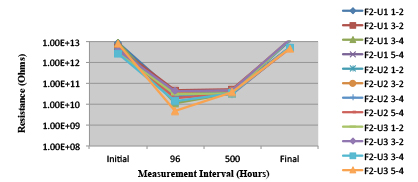
Figure 28. Wave Flux E – Dried. Minimum requirement: 2.24E+09 (Pass)
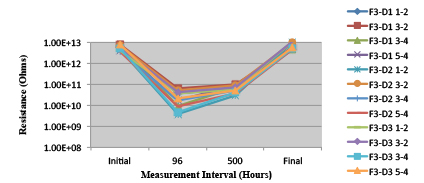
Figure 29. Wave Flux F - Activated. Minimum requirement: 1.86E+09 (Pass)
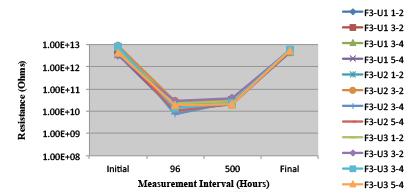
Figure 30. Wave Flux F - Dried. Minimum requirement: 1.68E +09 (Pass)
Phase 2: Compatibility results. The lead-free label was found completely compatible with the cleaning agent under all test conditions. However, the top coat of the leaded label included a varnish base and began to peel during the inline wash process. The top coat was completely removed from the label at the conclusion of the inline trials. The authors recommended the label supplier use the same top coat for the leaded label as used for the lead-free label. The new labels were reexamined and met the EMS’s specifications.
Figures 31 and 32 represent the control label that is currently used by the EMS for the lead-free process. This label was baked by passing three times through a reflow oven prior to conducting the compatibility trials.
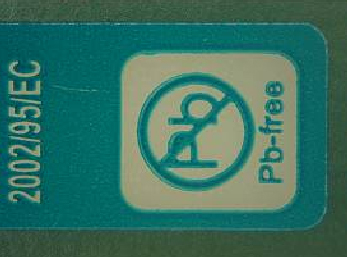
Figure 31. Before cleaning.
Figure 32. After cleaning – maintained ink integrity.
Figures 33 and 34 represent the label used in the leaded process which included a varnish coating. This label was also baked by passing three times through a reflow oven prior to conducting the compatibility trials.
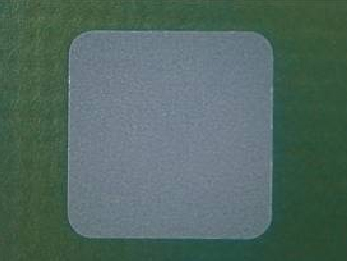
Figure 33. Lead-free label, before cleaning.
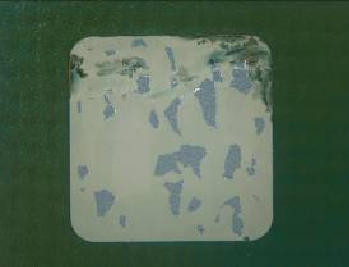
Figure 34. Lead-free label, after cleaning. Varnish removed after five passes through the inline cleaner.
No significant changes were observed with regard to the material compatibility of the components. All materials were found to be intact with no swelling, brittleness, or cracks when exposed to the cleaning process for a prolonged period.
Tables 11 and 12 detail the results of both the short term (15 min. of continuous exposure to Cleaning Agent A) and long term (24 hr. of continuous exposure to Cleaning Agent A) exposure testing. However, the color of the wire harness changed color from purple to grey during the 24 hr. test. This would never be the case in a production environment, since these components could not be continuously exposed to a cleaning agent for 24 consecutive hours. Both the EMS and OEM confirmed these test results.
Table 11. Short-Term Compatibility Results – Weight Difference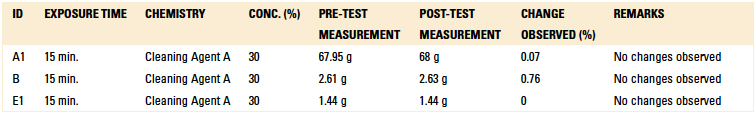
Table 12. Long-Term Compatibility Results – Weight Difference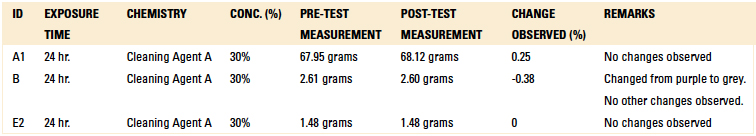
Conclusion
When building Class III products, it is essential to thoroughly understand the cleaning process and be assured that it has been optimized based on board design, cleaning equipment type, cleaning agent selected, operating parameters used, paste and flux types used and residues generated. The OEM for which this DoE was developed understood the importance of the cleaning process and sought empirical data to design and verify the cleaning process.
Using the EMS’s boards, paste and flux details, a DoE was developed enabling Zestron to select the most suitable cleaning agent and implement a testing program with cleaning equipment similar to that used by the EMS. Cleaning equipment parameters were optimized and excellent cleaning results were obtained, as indicated by visual inspection and ionic contamination analyses. The cleaning process efficiency was verified using EMS boards through Ion Chromatography and SEC analyses. Finally, additional verification regarding the effectiveness of the cleaning process was obtained through the use of SIR and ECM analyses employing IPC test coupons.
Once both the OEM and EMC were assured that the recommended cleaning process met their Class III cleanliness requirements, material and component compatibility testing was conducted. Critical board components were found to be completely compatible; however, the label supplier was required to make a top coat change on one of the two labels used.
Based on the results of this DoE, the cleaning process was implemented at the EMS site, and cleaning results were subsequently validated as meeting the OEM cleanliness specifications.
References
1. IPC-A-610E, “Acceptability of Electronic Assemblies,” April 2010.
2. IPC-TM-650 Method 2.3.25, “Ionic Cleanliness Testing of Bare PWBs.”
3. J-STD-001E, “Requirements for Soldered Electrical and Electronic Assemblies,” April 2010.
4. J-STD-004B, “Requirements for Soldering Fluxes,” November 2011.
5. IPC-TM-650, Method 2.6.3.7, “Surface Insulation Resistance.”
6. J-STD-004A, Requirements for Soldering Fluxes, January 2004.
7. IPC-TM-650, Method 2.6.14.1, “Electrochemical Migration Resistance Test.”
8. IPC-TM-650, Method 2.3.28A, “Ionic Analysis of Circuit Boards, Ion Chromatography Method.”
Ed.: This article was originally published in the IPC Apex Proceedings, February 2013 and is reprinted here with permission of the authors.
is senior process engineer, is application technology manager, and , M.S.Chem., is former vice president of the Americas and South Asia at Zestron America (zestronusa.com); u


Press Releases
- Seika Machinery’s SMI 2026 Webinar Series Continues with Focus on PCB Cleaning Before Solder Paste Printing
- Forwessun Expands Testing Capabilities through Strategic TRI Alliance
- Federal Electronics Expands Advanced Manufacturing Capabilities to Support Military and Aerospace Cable Assembly and Wire Harness Programs
- Altus Continues Irish Growth with Expansion of Engineering Team