

Current Issue
Where Productivity Meets Profitability
Buyers’ and sellers’ insights on how variables like cycle time, uptime and quality affect profit, return on investment and manufacturing capacity.
In the electronics industry we study specifications, test materials, conduct demonstrations and complete exhaustive in-house evaluations to prove application fit.
But what about financial fit? We’re well-versed at understanding how a product affects an assembly process, but understanding how a product or service impacts business metrics is often more difficult to predict.
For end-users and consumers, wouldn’t it be beneficial to understand financial potential right from the start? Understanding financial benefits early in the thought process could speed decisions on whether a product is something to consider, and later could help compare brands, support justification and sort out investment priorities.
Financial comparisons can help build a stronger value proposition and provide prospective customers a compelling reason to consider a product. From the supplier perspective, wouldn’t it be beneficial to correlate and promote process performance to financial benefits? A financial foundation may also be helpful differentiating a product from the competitors’.
Herein, we look at buyers’ and sellers’ insights on how variables like cycle time, uptime and quality affect profit, return on investment and manufacturing capacity. The calculator used helps show the effect of the input on the output. It focuses on assembly variables offering the most impact on manufacturing and business performance. Leading variables and the ones focused on here are cycle time, downtime and yield. While these figures won’t necessarily mirror every factory operation, they are a pretty good indicator of potential benefits. Figures could be easily changed in the model based on a specific application.
Baseline Comparison
Let’s start by using one manufacturing scenario to see how changes in cycle time, yield, and downtime impact financial performance. In this example we make conservative changes like decreasing cycle time by one second, increasing yield by 1% and reducing downtime thirty minutes each day.
The following results show even small incremental gains in productivity have a big impact on profitability and manufacturing capacity. In this case the combined benefit of these three conservative improvements delivers an increase in profitability of more than 12%. Let’s start by looking at the variables individually.
Yield improvement. Yield can be improved in many ways throughout a process. In this example, a 1% increase (93% to 94%) in yield equates to a profit increase of over 1%, or $8,500 annually (TABLE 1).
Table 1. Yield Improvement Effects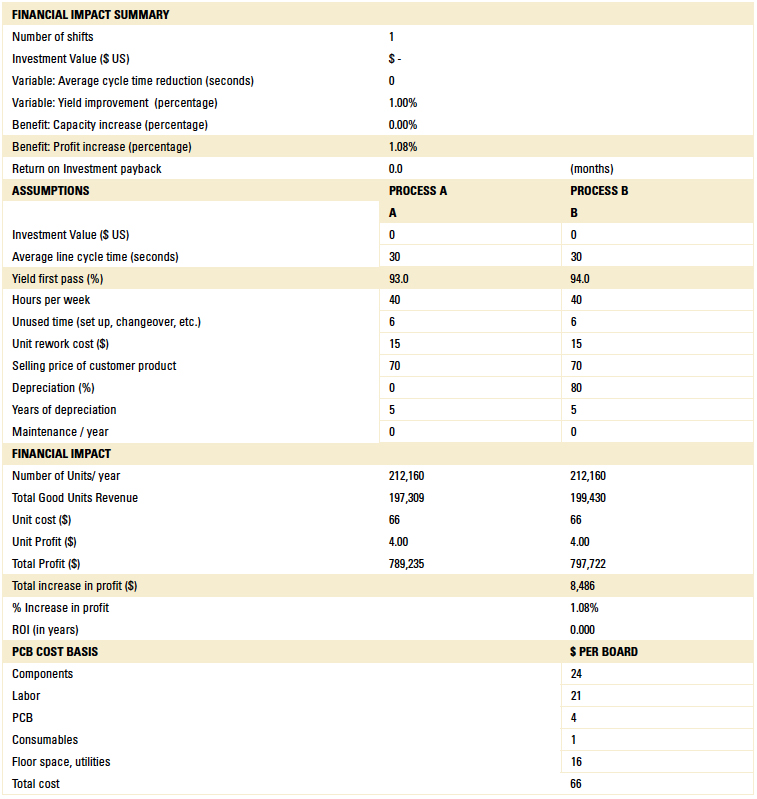
Cycle time reduction. Faster is better. This example correlates speed relative to profitability. In this case we’ve reduced cycle time by one second and realize a profitability gain of 3.5% or $27,000. There are many ways to grind out seconds in a process, and this math shows it’s worth the time to search it out (TABLE 2).
Table 2. Cycle Time Reduction Effects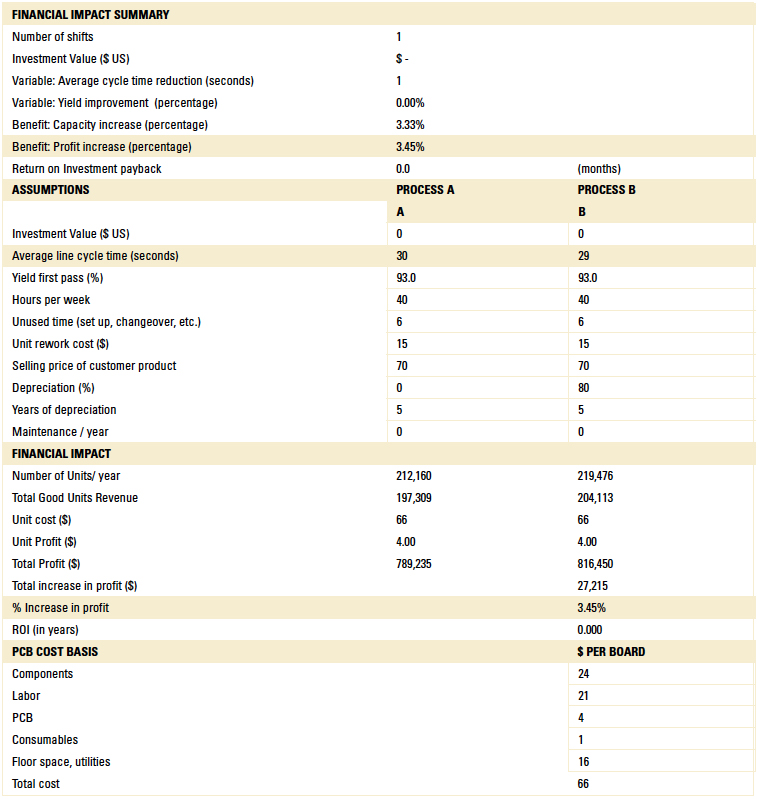
Converting downtime to uptime. The time variable is another critical component in maximizing profitability. In this example, 30 min. of unproductive time are converted to productive time per day, totaling 2.5 hr. per week. The profitability gain is more than 7%, adding $58,000 in annual profit (TABLE 3).
Table 3. Downtime to Uptime Conversion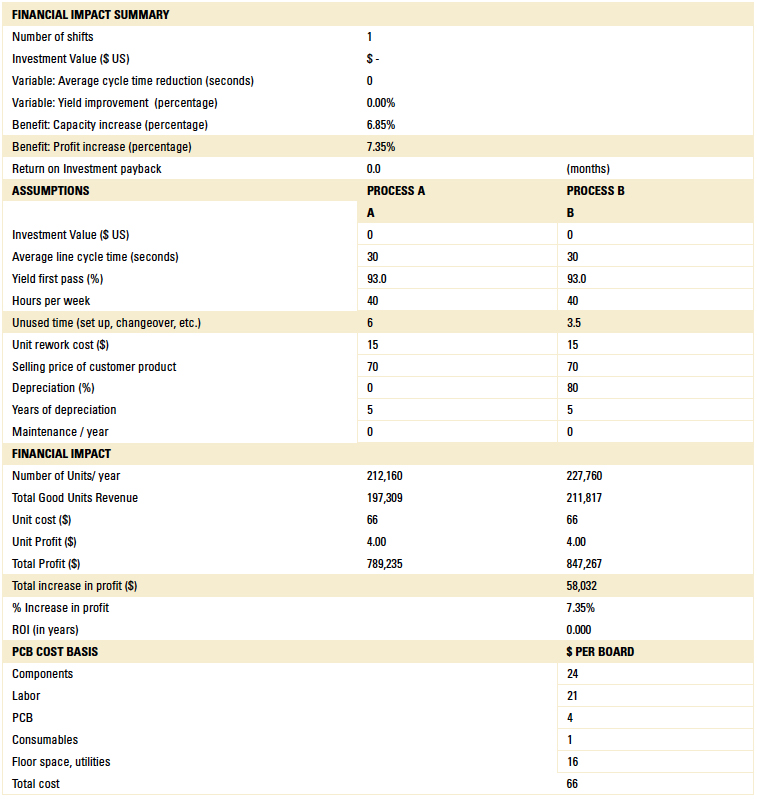
Combining the benefits. Combining the three variables, an increase in profitability of 12% is realized, or nearly $100,000 per year. The variables used to demonstrate the potential benefits are conservative: cycle time -1 sec., yield +1%, downtime -30 min. per day. This demonstrates the impact small incremental gains in productivity have on profitability (TABLE 4).
Table 4. Cumulative Effects of Productivity on Profitability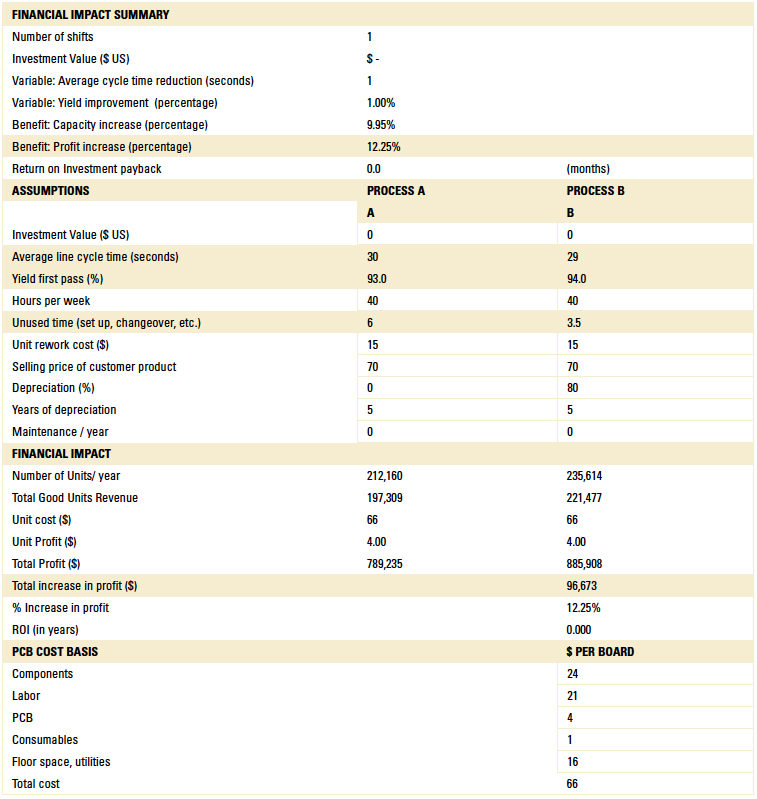
Shop Floor ROI
Now that we’ve looked at the impact of variables incrementally, let’s look at how they relate to return on investment and popular product investments. There are many ways to lose or leak time on a factory floor: waiting for materials, machine stoppage, extended breaks, paste replenishment, feeder change, and many others.
This example addresses a hidden opportunity: eliminating an accepted necessary evil through reflow oven stabilization
time between PCB runs. The investment to combat this is the addition of third-party add-on software used to minimize or eliminate stabilization time.
Let’s use the following assumption:
- Ten product runs per week, changing over one time per day.
- Loss of 20 min. (in addition to screen printer and placement machine setup) equaling 1.6 hr. of lost productivity per week.
- Conservative recovery of 80% or 1.3 hr. per week.
- Technology investment of $20,000, five-year depreciation, 20% residual value.
- The additional profit is $26,000, with an ROI of nine months (TABLE 5).
Table 5. Reflow Downtime ROI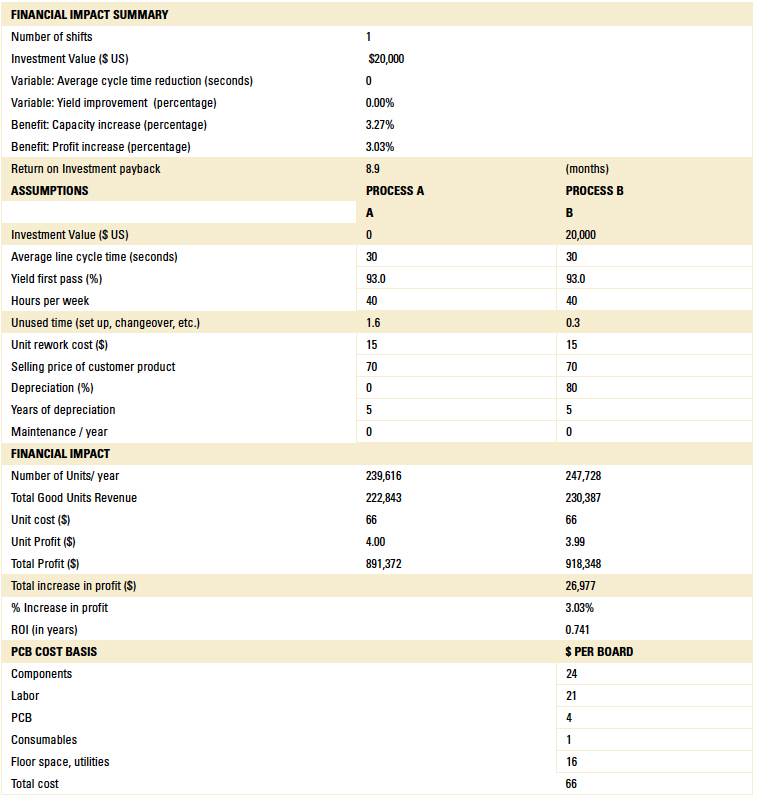
Investment costs associated with shop floor management software have been a challenge for many assembly businesses. But new more affordable solutions for digital work instructions, forced routing, traceability and detailed reporting are available. This example looks at how this product’s functionality affects financial contribution (TABLE 6).
Table 6. Functionality-Financial Contribution Relationship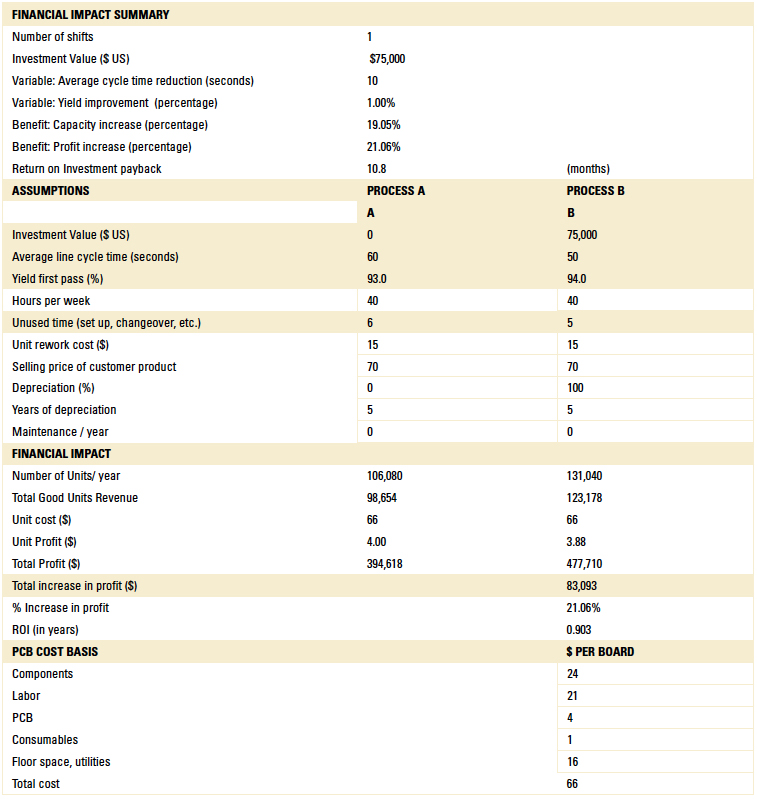
Let’s use the following assumption:
- Functionality includes digital work instructions, forced assembly routing, traceability and detailed reporting.
- Investment of $75,000, 25 user licenses, software, hardware for scanners and user interface, installation, full depreciation/five years.
- Modest cycle time gain of 10 sec. per workstation, yield improvement of 2%, reduced setup time one hr. per week.
- The benefit is $83,000 in annual profit and ROI of less than one year with secondary benefits of increased competitiveness and customer satisfaction.
It is a common belief that 60% or more defects can be traced to the screen printing process. A common action to address this challenge is the addition of solder paste inspection. SPI can provide a number of benefits, including quality improvement, cycle time and rework reduction, reduced troubleshooting and process optimization (TABLE 7).
Table 7. SPI Benefits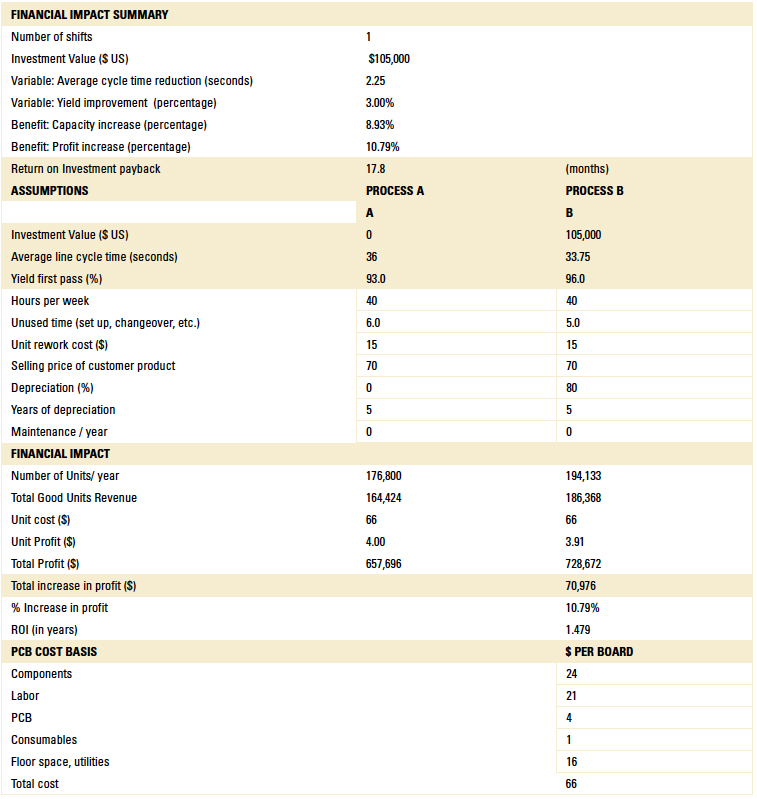
Let’s assume the following:
- Yield increases 3% (customers report 3 to 6% initial increase).
- Time saved troubleshooting / tweaking print process 1 hr. per week.
- Use of features like auto offset correction and real-time process monitoring.
- Optimized wipe:
- Existing
- Printer cycle time 30 sec. without wipe (PCB in to PCB out).
- Wiper cycle time 30 sec.
- Total print and wipe cycle time prior to optimization, 1 wipe each 5 PCBs – average cycle time 36 sec.
- Optimized
- Total print and wipe cycle time after optimization, 1 wipe each 8 PCBs – average cycle time 33.75 sec.
- Existing
- SPI machine investment $105,000, including closed-loop retrofit on printer ($5,000 estimate).
- Five-year depreciation with 20% residual value.
- The additional profit is $70,000, ROI 18 months, positive cash flow when leasing.
Comparing Brands and Models
Here is a common scenario. You are interested in two products, but there are differences in operational specs and price. One product sells for $100,000, the other $130,000. From the buyer perspective, the lower-priced unit is appealing, but which is the best choice based on profit contribution? Or from the seller’s perspective, how do you present your product from an investment position?
Let’s assume there are performance differences for the lower priced unit. These include three sec. slower cycle time, one hr. additional setup time per week, and lower yield by 0.25%.
Singling out the benefit from one variable – cycle time – the higher-priced product delivers $45,000 additional profit annually, which more than covers the difference in purchase price in the first year of use (TABLE 8). Combining all three benefits increases the profit to $65,000 (TABLE 9).
Table 8. Single Variable Benefits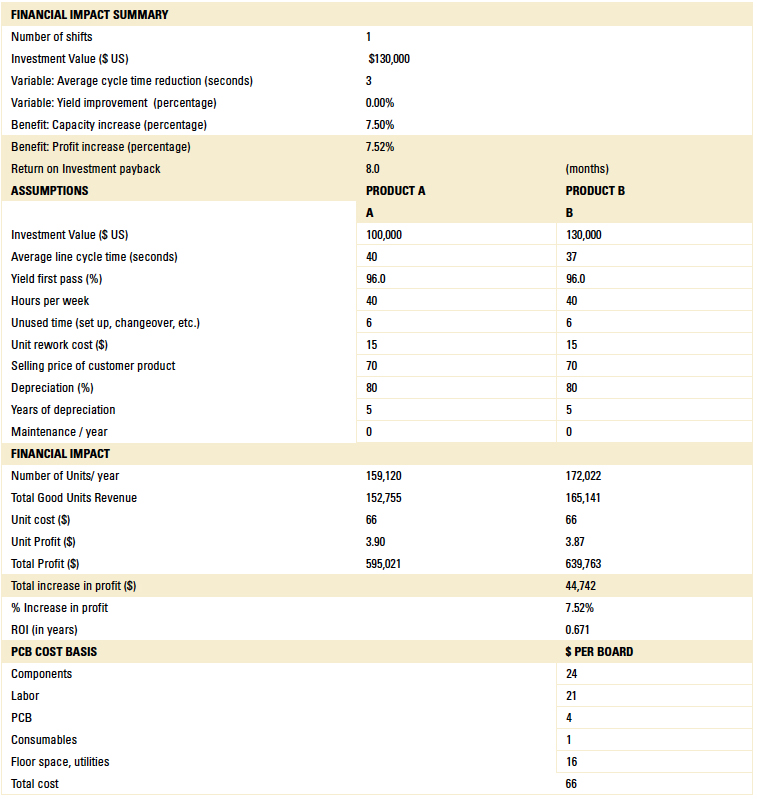
Table 9. Multiple Variable Benefits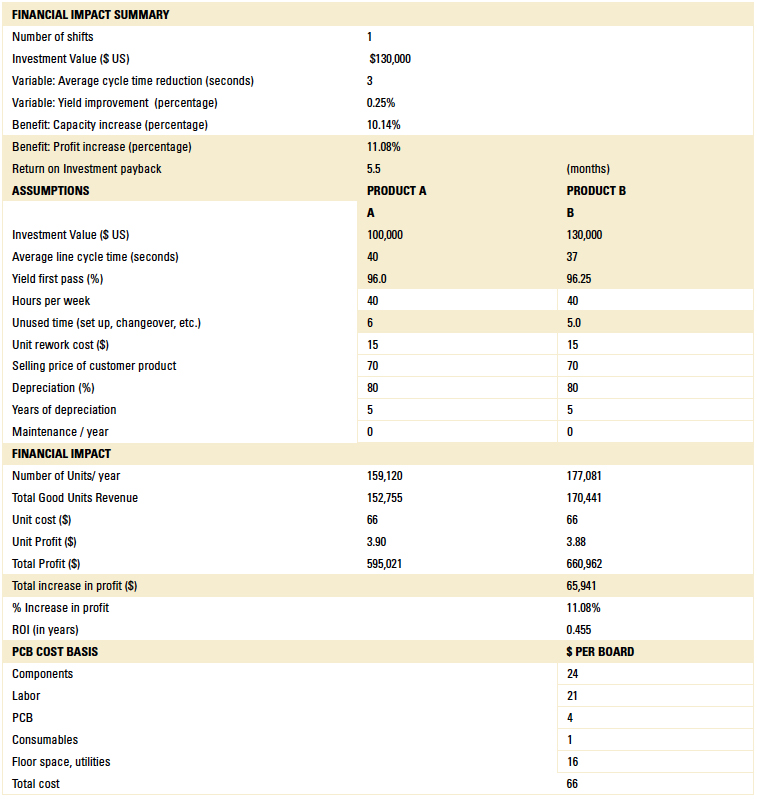
Conclusion
From the end-user perspective, understanding the financial impact of process change can be helpful when planning, budgeting, comparing equipment, determining investment priorities, and supporting continual process improvement efforts. The examples demonstrate how even small incremental improvement lowers cost and increases profit, manufacturing capacity, and competitiveness.
From the supplier standpoint, the analysis can be helpful in differentiating your brand, defining your value proposition, and assisting your customer with their return on investment calculations. Imagine the impact when you present your product in terms of its effect on profit, manufacturing capacity and ROI, instead of simply faster and better.
is founder of Utopia Sales Partners (utopiasalespartners.com); jeff@utopiasalespartners.com.


Press Releases
- Parmi Expands Mid-Atlantic Sales Coverage with Cope Assembly Products
- Seika Machinery to Host SMI 2026 Webinar Series Session 2 on PCB Slicing Methods and Low-Stress Separation
- Pillarhouse USA Expands BarTron, Inc. Sales Territory into Indiana
- Mycronic appoints Peter Andries as General Manager of MRSI Systems and VP of Global Technologies Division