

Current Issue
How to Use the Right Flux for Selective Soldering Applications
Several performance attributes must be considered under challenging thermal conditions.
The design of fluxes for a selective soldering application poses unique problems due to the localization of the soldering process. Both the heat treatment and the scrubbing action of the flux residue by the solder wave are confined in the soldered area. To address this specific issue, the flux formulator follows two complementary strategies.
First, the physical characteristics of the flux are optimized in synergy with the application process to minimize its footprint on the board. The flux must work in concert with the drop jet dispensing head to flow seamlessly (e.g., no clogging) during the entire operation, localize the deposit and, finally, stay in place.
Dispensing process parameters (open time, frequency, robot speed), as well as the board preheat temperature, are critical parameters,1 and their optimal settings depend on the characteristics of the flux (viscosity, surface tension, solid content, solvent).
Assembly materials also play an important part, as the optimal surface energy of the solder mask is typically lower than that for the conventional wave soldering process (35mN/m vs >50mN/m) in order to prevent excessive bleeding of the flux on the board after deposition. Hence, the design of a selective soldering flux is a good illustration of the mandatory collaboration between the formulators, equipment and assembly materials manufacturers from the very beginning of the design process.
Second, the flux chemical package is formulated to minimize the impact of unavoidable spreading and splashing events. These will result in partially heated flux residues, which won’t be removed by the washing action of the solder. As such, they pose a serious threat to assembly reliability, as ionic residues can induce electrochemical migration, corrosion and resistance losses, which could result in the in-field failure of the assembly when exposed to a moist environment.2,3 It is therefore of paramount importance to establish a correlation of the thermal history of the flux with the reliability of the residues. From this perspective, a series of activator packages has been designed specifically to guarantee an optimal reliability when partially heated.4 The reliability of the fluxes designed for the selective soldering application was assessed using common industry standards, where the flux was subjected to various thermal conditioning (TABLE 1).
Table 1. Flux Reliability Testing Methods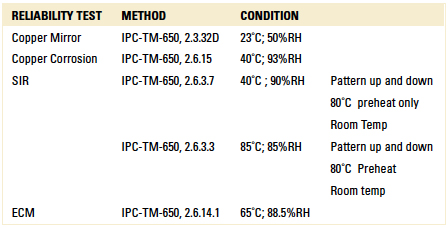
A statistically significant experimental protocol was conducted on Ersa selective soldering equipment to evaluate the impact of materials and process parameters on the following response factors: dispensing performance (clogging and satellites), flux spread and soldering performance. The results of these experiments are reported in the following paragraphs.
Flux spread. Flux spread is influenced by the surface tension of the flux and its temperature. Alcohol-based fluxes have a much lower surface tension than VOC-free fluxes, which are water-based (22mN/m at 25˚C vs. 72mN/m). Also, the dispensing temperature will tend to favor spreading by lowering the flux viscosity.
On the other hand, the impact of the board preheat will depend on the nature of the flux; VOC-free fluxes tend to spread more on warmer boards, while an alcohol-based board will show an opposite trend as the temperature thinning effect competes with the high drying rate of the flux. Finally, the surface energy of the solder mask is another critical parameter; lower surface energies are favored for selective soldering fluxes compared with conventional wave soldering fluxes (35mN/m vs > 50mN/m) to increase the contact angle of the flux on the substrate. This is easily understood when looking at the balance of surface
tensions modeled in Young’s equation: γSG=γSL+γLGcosθ. It should be noted preheating the board may impact the surface energy of the solder mask.
We estimate the intrinsic spreading of fluxes by deposition on a representative set of PCBs with various solder mask types. In contrast, in-process optimizations of the flux spread are conducted by directing the drop jet on the shiny side of an aluminum foil, which presents a comparable surface energy, and measuring the dried deposits after preheat as illustrated in FIGURE 1.
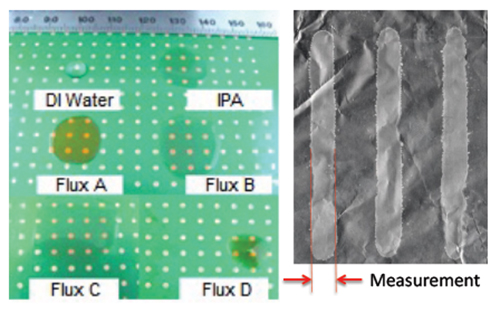
Figure 1. Flux spread measurement (Left: PCB; right: Al foil).
Drop jet dispense: clogging and satellites. High-frequency drop jet technology has been developed to narrow the spray pattern compared to atomizing-type aerosol spray heads or ultrasonic spray fluxers. The deflection of the flux droplets is minimized, but occurrence of satellites is always a possibility; these very small flux droplets varying in sizes appear in random directions outside of the flux direct deposition corona. They depend on the flux physicochemical characteristics (viscoelastic properties, surface tension), hence its formulation, coupled with the jetting process itself. It is critical to mitigate the formation of satellites, as these side deposits won’t be exposed to the same heat cycle and solder scrubbing mechanism as non-deflected droplets, and will therefore pose a serious threat of electrochemical migration under bias in a moist environment.
Another processing issue frequently encountered during dispense is the clogging of the drop-jet fluxer, as a result of the narrow channels of the spray head (typically 130µm) combined with the high-volatility of alcohol-based selective soldering fluxes.
Both clogging and satellite formation are assessed during the same set of experiments, which enable us to screen our flux formulation efficiently on industrial selective soldering equipment. Fax paper is used to identify the location of the geometry of droplet deposits. It should be noted that use of fax paper for in-process spread measurement is typically avoided, as the absorption of flux into the fabric of the substrate will result in an inaccurate representation of the flux spread data.
The tests consist of successive deposition cycles executed at increasing time intervals. Twenty dots are printed at 2 sec. intervals in one cycle. This sequence is repeated four times, with 30 sec. breaks between each cycle. The whole procedure is then repeated four times, this time with 15 min. breaks in between. The dot geometries and satellite positions are computed for the 500 dots deposited in total using image analysis software. The successive breaks during the sequence make the procedure particularly aggressive. In our experience, a continuous flow of flux through the drop jet unit self-regenerates the head, while the breaks give time for the deposits to accumulate, ripen and create solid deposits on the side, which are more difficult to remove when the sequence is restarted. In consequence, fluxes can be efficiently discriminated through this experimental protocol.
FIGURE 2 shows a representative set of deposition patterns obtained with various fluxes: the flux #2 deposition conditions were near perfect, while #10, #6 and #13 show multiple defects. Observe that satellites and variations in surface area of the deposit often happen at the beginning of the sequence, where
deposit concentration is at its maximum, which demonstrates this effect is the major root cause for dispensing failures.
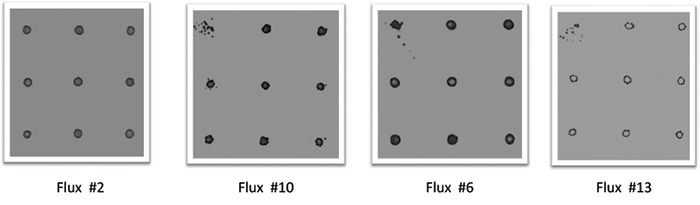
Figure 2. Typical deposition patterns for the drop jet dispensing test.
Overall, 15 formulas were screened using the statistically significant set of data generated during these complex deposition sequences. Results of the deposition pattern analysis are reported in FIGURE 3. The efficiency of this screening method is confirmed, as large differences are observed between fluxes, in terms of uniformity of the deposits across the whole deposition sequence (dot area and dot circle), as well as the occurrence and spatial distribution of the satellites. Fluxes #1, 2, 3 and 4 present the best dispensing performance and were selected for the final soldering performance assessment.
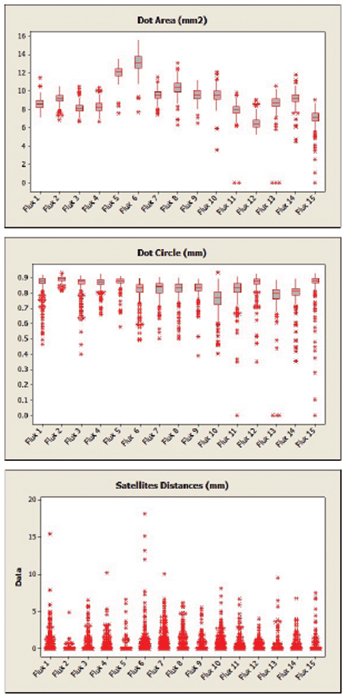
Figure 3. Dispensing test results for 15 experimental formula. Statistical analysis of 500 data points per formula, collected through an image analysis software.
Soldering performance. A performance evaluation was completed on an industrial selective wave soldering machine from Ersa (FIGURE 4), using 93 mil FR-4 boards made of four copper layers (1/2/2/1 oz.), solder mask over bare copper (SMOBC) and an OSP finish (FIGURE 5).
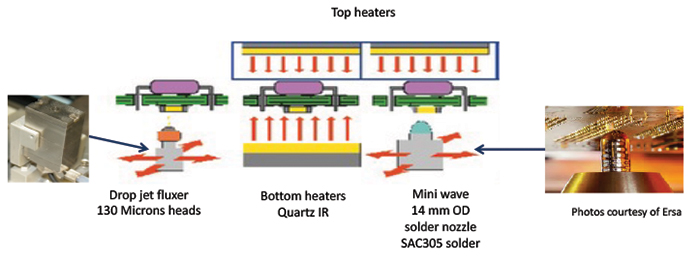
Figure 4. Selective soldering equipment configuration.
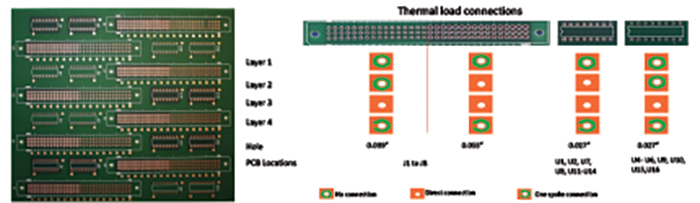
Figure 5. Selective soldering testing board.
These boards were populated with 16-pin dual inline packages (DIPs) containing IC chips and 96-pin Eurocard connectors.
To determine the soldering performances of the fluxes, the L16 Taguchi design of experiment reported in TABLE 2 was used.
Table 2. Soldering Performance DoE parameters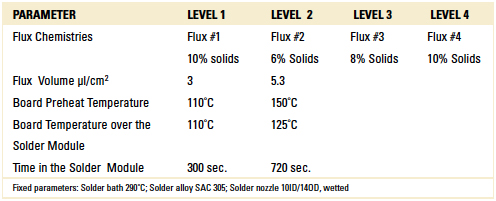
The response factors were flux spread (measured area), % hole fill (evaluated by x-ray diffraction), and the number of solder bridges and solder balls (visual count).
The statistical analysis of the results is reported in FIGURE 6. Main effects are represented here, as second-order interactions were found to be statistically insignificant.
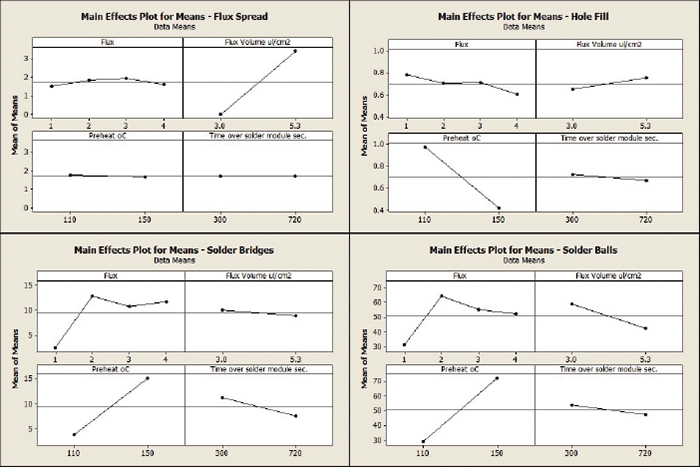
Figure 6. Soldering performance DoE results.
All fluxes presented similar spreading results, the only impactful process parameter being the dispensed volume. Hole fill performance was found to be comparable between fluxes, while particular attention needs to be given to the board preheat temperature. This result is in good agreement with our background knowledge. Preheat times are relatively long in point-to-point selective soldering applications, which poses a challenge to the thermal stability of the activator packages. In this context, very satisfactory performance is found with all fluxes for a preheat temperature of 110˚C. More flux discrimination was found when considering soldering defects. Flux #1 clearly stands out compared with the three other fluxes, with minimal defect rates observed in all conditions. The strong impact of board preheat temperature on defects confirms our initial interpretation on the activators’ thermal stability envelope.
Conclusion
The design of high-performance fluxes for selective soldering applications requires a combination of formulation, application and equipment expertise that mandates a strong partnership between flux designer and equipment manufacturer. Multiple performance aspects have to be taken into account. The flux itself must have proven reliability (corrosion, electrochemical migration) under various heat exposure conditions, in particular when only partially activated. Having down-selected a series of fluxes filling this requirement, it is necessary to conduct statistically designed experiments on industrial wave soldering machines to map the relationships between flux characteristics and selective process friendliness. In this area, multiple performance attributes are considered: compatibility with drop jet dispensing (clogging effects, cleaning frequency, and satellite formation), spreading on the board (in actual processing conditions, with multiple solder resist types) and soldering performance (fluxing activity, thermal stability) as measured by barrel filling and defect production.
References
1. G. Diepstraten, “Achieving Repeatable, Consistent Control over the Selective Production Process,” SMTA International, September 2015.
2. B. Tolla, Y. Shi, X. Wei and H. Bhavsar, “Chemical Influences on the Reliability of Complex Assemblies,” SMTA SE Asia Proceedings, April 2015.
3. B. Tolla, D. Jean, H. Bhavsar, Y. Shi and X. Wei, “Reactivity of No-Clean Flux Residues in Electronic Assemblies: A Systematic Study,” SMTA International, September 2015.
4. X. Wei, K. Loomis, J. Allen and B. Tolla, “Partially-Activated Flux Residue Influence on Surface Insulation Resistance of Electronic Assemblies,” SMTA International, September 2015.
Acknowledgments
The authors would like to acknowledge Kyle Loomis and Jennifer Allen from Kester for their applied knowledge of reliability testing for the electronics assembly industry.
Ed.: This article was first published in the IPC Apex Expo Proceedings, March 2016 and is reprinted here with permission of the authors.
is global R&D director, is technology manager and was technology and development manager at Kester (kester.com); btolla@kester.com.


Press Releases
- Nordson Test & Inspection Announces Strategic Partnership with Quiptech Mexico to Expand Market Presence
- Express Manufacturing, Inc. Expands Inspection Capabilities with Its Second TRI 3D AXI System
- Javad EMS to Add New ESPEC Temperature Chamber to Support Growing Mil/Aero Work
- ubersmt Builds Out SMT Line with Promation PCB Handling Equipment