

Current Issue
Concentration Monitoring Closed Loop Control – Phase 2
Novel acoustic measurement technology can accurately maintain wash bath concentration when flux residue is present.
Aqueous-based cleaning systems using custom-engineered cleaning agents have become standard for cleaning electronics assemblies. For spray-in-air systems, typical wash bath concentration is maintained in the range of 10% to 20% by volume. Critical to the efficiency of these systems is wash bath concentration monitoring and control. However, as assemblies are cleaned, contamination, mainly comprised of solubilized flux residues, accumulates in the wash bath. Additionally, during the normal course of operation, wash bath volume is reduced due to evaporation and drag-out, thereby further affecting its concentration. Left unchecked, the effectiveness of the cleaning system is compromised, and the expected cleaning results will not be achieved.
Numerous wash bath concentration monitoring technologies are available, each with its advantages and disadvantages. At a recent conference, a technical study1 was presented detailing available technologies. Additionally, the latest concentration monitoring technique was presented, that is, one that employed acoustic sensing technology (referred to as flowsensor). A comprehensive design of experiment (DoE) was executed whereby current concentration monitoring methods were examined and compared with that of the flowsensor technology.
The previous study was limited to RMA flux residue and a single micro phase cleaning agent. Comparative test data was presented, as well as preliminary field data from one beta site. The results of this study verified the accuracy of acoustic sensing technology for concentration control in the presence of flux residue.
This study evaluates extensive flowsensor field data generated from two locations, herein referred to as beta site A and B. At beta site A, the original beta site reference in the previous study, the flowsensor technology is employed for concentration indication only. In this case, the process included an RMA flux system and micro phase technology cleaning agent. Wash bath makeup, or the addition of DI-water and concentrate, was manually completed based on the flowsensor concentration readings.
At beta site B, the flowsensor closed-loop control system (flowsensor CLC) was employed, whereby DI-water and concentrate makeup are automatic, thereby maintaining the wash bath concentration at the desired level. In this case, the process included both RMA and water-soluble flux systems and dynamic surfactant cleaning agent technology. In both cases, the flowsensor concentration reading was verified by generally accepted alternative techniques.
Accurate concentration measurement in the presence of contamination is necessary for any concentration measurement technology. For this study, the authors decided to use nonvolatile residue (NVR) analysis as a contamination measurement.2 Utilizing the wash bath samples obtained from Beta Site B, NVR analyses were conducted and referenced as an indicator of contamination load, as well as the accuracy of the flowsensor CLC system to indicate and control wash bath concentration in the presence of contamination.
For reasons of space, the background information from the original study1 is not repeated here. (The figures included herein have not been renumbered from the original paper, and hence start at Figure 7.) In summary, the original study presents pros and cons of initial concentration analysis techniques, as well as the results of the initial DoE detailing the preliminary evaluation of acoustic sensing technology for engineered cleaning agents.
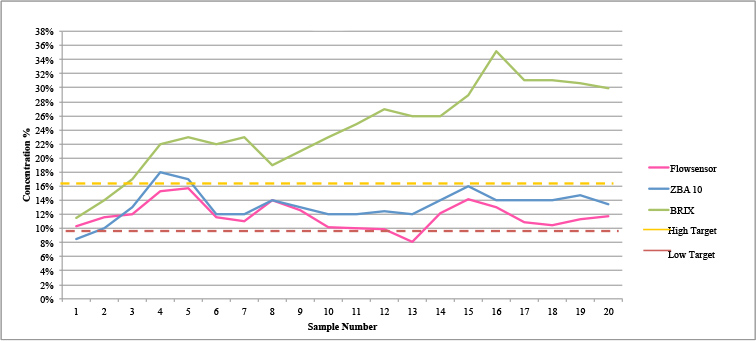
Figure 7. Beta Site A concentration data comparison.
All tests and data analysis were performed at the company technical center.
RMA Flux Load Analysis (micro phase cleaning agent). Utilizing a batch cleaner, the wash tank was filled with fresh cleaning agent to an initial concentration of 15%, as verified by refractive index, bath analyzer and flowsensor. The cleaner basket remained empty as this test examined the effect of flux load on concentration measurement only.
For this test, high-solids content RMA liquid flux was sourced. Concentrated liquid flux was used to minimize the overall flux volume required. To create the concentrated flux, liquid flux was evaporated such that the volume was reduced until it reached the known solid content. In this case, the liquid flux solid content was 33%.
Following cycle start, flux was added, concentration measurements were taken, then diluted, and concentration re-measured employing refractive index and the bath analyzer. The flowsensor continuously recorded the wash bath concentration throughout the test.
As noted in the original study, the initial wash bath concentration measured by refractive index and bath analyzer was confirmed at 15% concentration. Flux was added to a concentration of 1% by volume. During this wash cycle, the flowsensor measurements remained fairly constant throughout. At time t2, the bath analyzer measurement remained accurate, yet the refractive index measured 22% (actual 14%). The wash bath was then diluted with DI-water. The flowsensor measured 7%, as also indicated by the bath analyzer, yet the refractive index measured 15%.
As expected, in the presence of flux residue, the refractive index reading overstated the wash bath concentration in both instances. At a 1% flux load, both the flowsensor and the bath analyzer accurately indicated the wash concentration even as it was diluted by half.
Methodology
Having established the performance of the flowsensor as an accurate concentration monitoring technology, the authors selected two beta sites, described as A and B, for detailed field evaluation. Two versions of the flowsensor were employed at the beta sites. The flowsensor type was installed in each location and concentration data monitored, recorded and analyzed throughout the beta test period.
Beta Site A employed a wash bath concentration monitoring flowsensor. (Preliminary data – four days – from this beta test site was presented in the previous paper.1 This study presents 20 days of field data.) The customer was a global security and aerospace company principally engaged in the research, design, development, manufacture, integration and sustainment of advanced technology systems, products and services.
The flowsensor type evaluated was an inline version with continuous concentration monitoring and display. The process required manual DI-water and cleaning agent concentrate makeup.
Beta Site B employed a Flowsensor CLC, which performs wash bath concentration monitoring with closed loop control. The customer was a contract manufacturer that provides design, engineering, system integration, and testing services to industrial, energy, medical, defense and aerospace industries.
The flowsensor type evaluated was an inline version with continuous concentration monitoring and display complete with automated DI-water and concentrate makeup. This system is integrated with the inline wash section pump. That is, whenever the wash section pump is actuated, wash bath flows through the flowsensor CLC system. Concentration measurement is logged and wash bath makeup consisting of DI-water or concentrate cleaning agent is automatically added as required.
Beta site A data review. In this case, the customer had a qualified cleaning process for many years using an inline spray-in-air cleaner. Process parameters are detailed in Table 1.
Table 1. Inline Cleaner Operating Parameters, Dynamic Surfactant
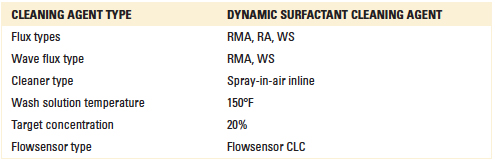
Upon installing the flowsensor, fresh wash bath was added and the concentration adjusted to the 12% target. As the customer monitored the concentration via the flowsensor controller, DI-water and/or cleaning agent concentrate was added using a dosing pump that was manually actuated, as required. For the duration of the test period, the wash bath was not changed.
Throughout the test period, the customer extracted bath samples daily. The flowsensor concentration, as indicated by the controller, was recorded on the bottle and the sample returned to the company technical center for further evaluation.
At the company, the bath sample was analyzed by refractometry (BRIX) and the bath analyzer. These data points, as well as the flowsensor concentration value as indicated on the bath sample by the customer, were plotted and are detailed in Figure 7.
Results. In this case, the concentration target was 12%. As DI-water and concentration makeup were added manually, the actual concentration varied from 10% to 16%. The bath analyzer and the flowsensor results mirrored each other.
However, refractive index overstated concentration with increasing error as testing progressed. The authors attributed this increasing error to the increased wash bath contamination.
Beta site B data review. This customer had a qualified inline cleaning process that ran 10 to 12 hr. a day. Prior to installing the flowsensor CLC system, concentration was monitored using the bath analyzer. The line operator spent more than half of his time monitoring and adjusting wash bath concentration, adding DI-water and/or cleaning agent concentrate as required.
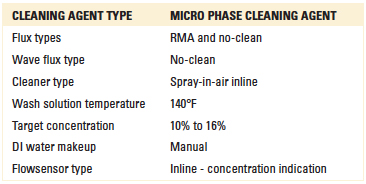
Process parameters are detailed in Table 2.
Table 2. Inline Cleaner Operating Parameters, Micro Phase
Following installation of the flowsensor CLC, fresh wash bath was added and the concentration adjusted to 20%. The concentration range of the flowsensor controller was set to ±2%. The control system monitored wash bath concentration and added DI-water and concentrate as required to maintain the desired concentration range. Onsite concentration data recorded by the control system are plotted in Figure 8.
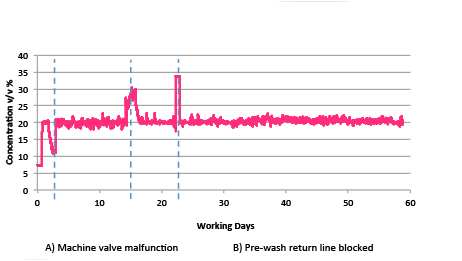
Figure 8. Flowsensor concentration measurement.
Data presented in Figure 8 represent 45 working days (10 weeks) of continuous operation without a bath change. During this time, three deviations are indicated.
As can be seen, the flowsensor CLC system captured concentration deviations and the time period such that these data could be correlated with other process control data points and that any corrective action deemed necessary could be taken.
Throughout the test period, the customer extracted daily bath samples. The wash bath concentration, as indicated by the CLC system, was recorded and the sample returned to the company technical center for further evaluation.
At the company, the bath sample was analyzed by refractometry (BRIX), the bath analyzer and GC (gas chromatography). These data points, as well as the CLC value as indicated on the bath sample by the customer, are plotted in Figure 9.
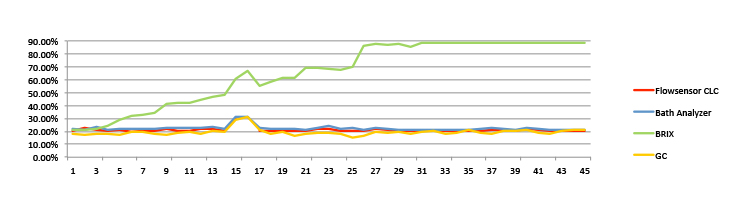
Figure 9. Beta Site B concentration data comparison.
From this figure, it can be observed that:
- As wash bath contamination increases, refractive index increases.
- The high concentration reading (Day 15) reflects the same error indicated at point B of Figure 8.
- The bath analyzer, GC and flowsensor results mirror each other, indicating accurate concentration measurement and control.
As detailed in Figure 8, the wash bath concentration, as controlled by the flowsensor CLC system, remained steady throughout the test period. In this case, the deviation from concentration set point was much smaller compared to Beta Site A (Figure 7). This is attributed to the automated control of DI-water and concentrate addition. It was certainly expected that wash bath contamination was increasing, even though concentration level remained within the process specification. Thus, the authors decided to evaluate NVR as a measure of wash bath contamination.
NVR was determined employing a standard technique of adding a known amount of sample to a pre-weighed evaporating dish. The dish was placed in a 200°C oven for approximately three hours or until fuming stopped, leaving solids residue remaining. The NVR analysis was conducted at the company technical center using the daily samples obtained from the beta site. As anticipated, NVR values gradually increased as the test progressed. The NVR analysis was based on wash bath samples received from startup through day 45. The results in Figure 10 indicate that the NVR value steadily increased to approximately 7.5% over the 45-day test period. Although the NVR value increased more than sevenfold, the flowsensor CLC was able to measure and maintain concentration accurately.
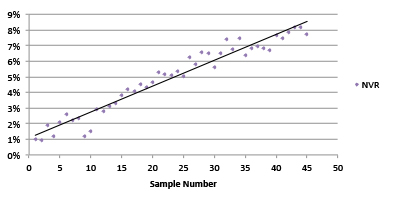
Figure 10.Nonvolatile residue (NVR) analysis.
Conclusions
In this study, the flowsensor or acoustic concentration measurement system was further evaluated at the original beta site detailing 20 days of concentration monitoring data. At this site, the electronics assembly process used RMA flux and a cleaning process based on a micro phase cleaning agent.
Additionally, the flowsensor CLC or closed loop concentration monitoring and control system was installed at a second beta site and evaluated over a 45-day period. At this site, the electronics assembly process used RMA-based and water-soluble flux and a cleaning process based on a dynamic surfactant cleaning agent.
Upon review of the beta test data, the flowsensor employed at beta site A was found to accurately indicate wash bath concentration, while the flowsensor CLC, employed at beta site B, was found to accurately indicate and control wash bath concentration, each throughout the test period. In each case, the flowsensor concentration data was compared with established measurement methods to confirm process accuracy.
With any electronics substrate cleaning system, wash bath contamination accumulates over time, principally in the form of flux residues. The ability to determine accurate concentration measurement in the presence of contamination is critical to any monitoring and control system. Using bath samples collected from beta site B and a contamination analysis based on NVR, this study verified that acoustic measurement technology, employed in the form of the flowsensor CLC within this study, can accurately indicate and control wash bath concentration in the presence of flux residue.
References
- Umut Tosun, “Concentration Monitoring and Closed Loop Control – A Technological Advancement,” SMTA International Proceedings, October 2013.
- William T. Wright, “Managing Wash Lines and Controlling White Residue by Statistical Process Control,” SMTA International Proceedings, September 2003.
- Michael McCutchen, “Precision and Accuracy in a Cleaning Process,” PCD&F/CIRCUITS ASSEMBLY, August 2012.
Ed.: This article is adapted from a paper originally published in the IPC Apex Expo Proceedings, March 2014, and is reprinted here with permission of the authors.
is an application technology manager, and Axel Vargas is a sales engineer at Zestron (zestron.com); umut.tosun@zestronusa.com. Bryan Kim, Ph.D., is director of engineering at Pressure Products (pressureproducts.com); bhkim@pressureproducts.com.


Press Releases
- VJ Electronix Expands U.S. Coverage with MaRC Technologies Representation in the Pacific Northwest
- Absolute EMS Adopts Luminovo to Modernize and Streamline Quoting
- Iiris Heiskanen Appointed as New CFO of Scanfil
- CE3S Expands Electrostatic Measurement Offering with Next-Generation Compact Static Field Meter from Desco Industries