Normal Data Are Nearly Never Normal
 But don’t obsess over the distribution.
Yes, I said it. Normal data are nearly never normal.
In Six Sigma classes we study outliers, shift, drift and special cause events. But what we don’t always consider is that these “unexpected” data points may be part of the process and not as rare as we think.
First, let’s look at a set of screw torque data. The chart in FIGURE 1 is for a set of screw torques taken sequentially from a “smart” driver. We can see the data are normal (p=0.895), and the histogram and time series plot back that up.
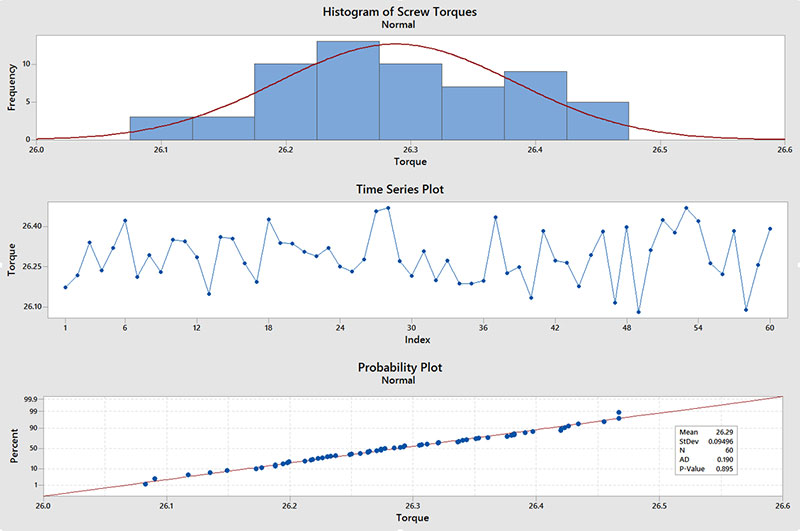
Figure 1. Histogram of screw torques.
Now let’s look at another set of data, this time for solder paste print height (FIGURE 2). With a p-value of 0.096, these data can also be considered normal using our usual definition of p>0.05.
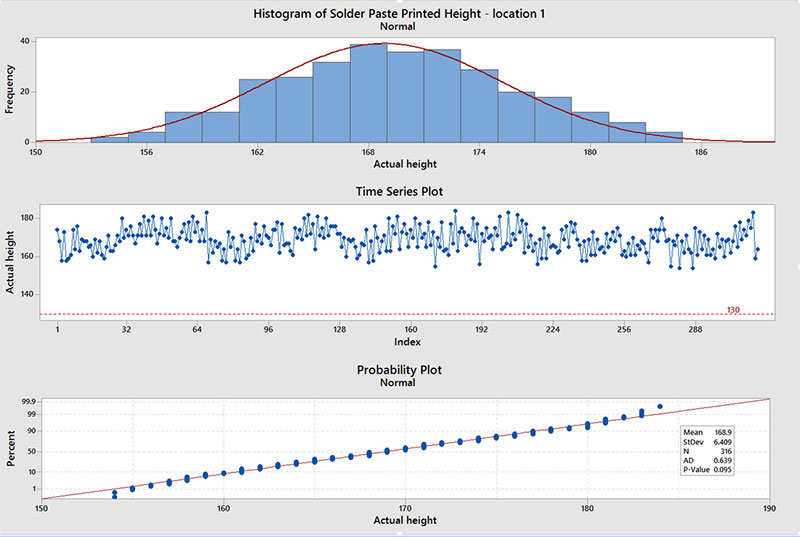
Figure 2. Histogram of solder paste printed height – location.
However, when we look at the time series plot, we can see the data appears to be rising and falling. Before calculating capability or declaring my process ready to go, I may want to dig a little deeper and explore this pattern.
Minitab has a smoothing function that, with a little playing with the parameters, can reveal patterns. Also, doing a moving average can help to bring out patterns as well.
FIGURE 3 shows the actual solder print data compared to smoothed data and the moving average. Maybe there’s a pattern here, maybe not. At least you can now walk the process, talk to the operators, and observe how the process works. This can help you find if the pattern is real, and if so, where it is coming from.
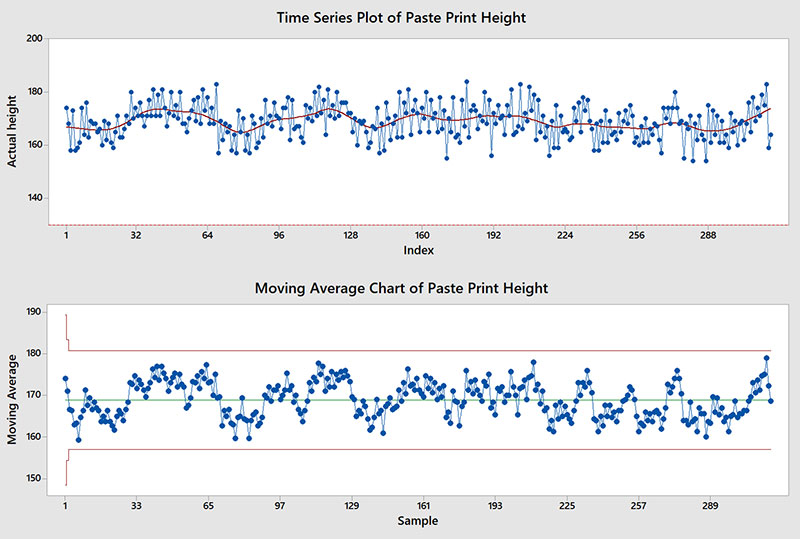
Figure 3. Time series plot of actual paste height.
Finally, let’s look at one more set of solder paste data that illustrates another way data that should be normal actually is not normal. But this time, even though we knew that solder paste print height data should be normal, we ran the time series chart along with the capability study.
FIGURE 4 shows these charts. Obviously something going on here in the process is creating a dual distribution. Time to head back to the shop floor and investigate.
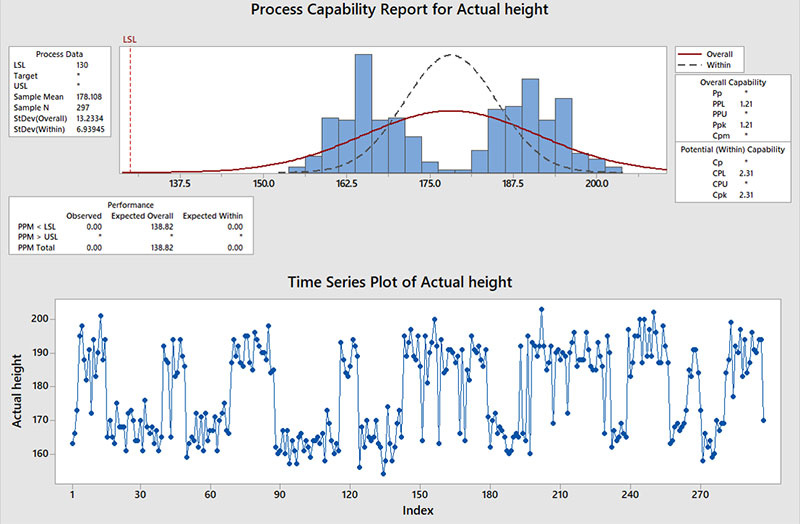
Figure 4. Process capability report for actual height.
Don’t assume normality, even if past data have proven to be normal. Stuff happens, things change. While some outliers may be rare and not worth investigating, sometimes they are speaking to us. Massage the data and change how you view it. Use your statistical and graphing tools to pull out potential patterns. Then go to the gemba. Interview operators, explore maintenance logs, study the process inputs, outputs, noise factors and hidden factories. Find out if those odd non-normal data points are telling a story worth hearing. Dig deep and learn.
And remember: Normal data are nearly never normal.
is a Six Sigma Master Black Belt with over 40 years’ experience in electronics manufacturing; john.borneman@gmail.com.


