Global PC Shipments Return to Growth in Q1
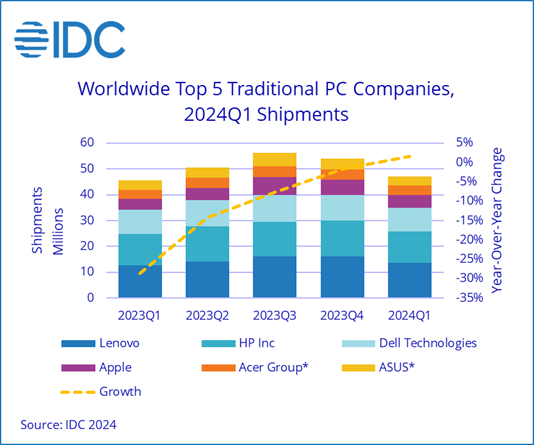
NEEDHAM, MA – After two years of decline, the worldwide traditional PC market returned to growth during the first quarter with 59.8 million shipments, growing 1.5% year over year, according to preliminary results from IDC's Worldwide Quarterly Personal Computing Device Tracker.
Growth was largely achieved due to easy year-over-year comparisons as the market declined 28.7% during the first quarter of 2023, which was the lowest point in PC history. In addition, global PC shipments finally returned to pre-pandemic levels as the first quarter's volumes rivaled those seen in 2019's first quarter, when 60.5 million units were shipped.

With inflation numbers trending down, PC shipments have begun to recover in most regions, leading to growth in the Americas as well as Europe, the Middle East and Africa (EMEA). However, the deflationary pressures in China directly impacted the global PC market. As the largest consumer of desktop PCs, weak demand in China led to yet another quarter of declines for global desktop shipments, which already faced pressure from notebooks as the preferred form factor.
"Despite China's struggles, the recovery is expected to continue in 2024 as newer AI PCs hit shelves later this year and as commercial buyers begin refreshing the PCs that were purchased during the pandemic," said Jitesh Ubrani, research manager with IDC's Worldwide Mobile Device Trackers. "Along with growth in shipments, AI PCs are also expected to carry higher price tags, providing further opportunity for PC and component makers."
Among the top 5 companies, Lenovo once again held the top spot and outgrew the market largely due to the steep decline in shipments experienced in the first quarter of 2023. Apple's strong growth was also due to an outsized decline in the prior year.
|
Top 5 Companies, Worldwide Traditional PC Shipments, Market Share, and Year-Over-Year Growth, Q1 2024 (Preliminary results, shipments are in millions of units) |
|||||
|
Company |
1Q24 Shipments |
1Q24 Market Share |
1Q23 Shipments |
1Q23 Market Share |
1Q24/1Q23 Growth |
|
1. Lenovo |
13.7 |
23.0% |
12.7 |
21.6% |
7.8% |
|
2. HP Inc |
12.0 |
20.1% |
12.0 |
20.4% |
0.2% |
|
3. Dell Technologies |
9.3 |
15.5% |
9.5 |
16.1% |
-2.2% |
|
4. Apple |
4.8 |
8.1% |
4.2 |
7.1% |
14.6% |
|
5. Acer Group* |
3.7 |
6.2% |
3.4 |
5.7% |
9.2% |
|
5. ASUS* |
3.6 |
6.1% |
3.8 |
6.4% |
-4.5% |
|
Others |
12.6 |
21.1% |
13.3 |
22.6% |
-5.0% |
|
Total |
59.8 |
100.0% |
58.9 |
100.0% |
1.5% |
|
Source: IDC Quarterly Personal Computing Device Tracker, April 8, 2024 |
|||||
Notes:
* IDC declares a statistical tie in the Personal Computing Device market when there is a difference of one tenth of one percent (0.1%) or less in the shipment shares among two or more vendors.
Traditional PCs include Desktops, Notebooks, and Workstations and do not include Tablets or x86 Servers. Detachable Tablets and Slate Tablets are part of the Personal Computing Device Tracker but are not addressed in this press release.
Shipments include shipments to distribution channels or end users. OEM sales are counted under the company/brand under which they are sold.


