Evaluating Rinsing Effectiveness in Spray-In-Air Cleaners
Given the surface tension of DI water, how effective is this process?
For high-reliability cleaning of modern board designs, undercomponent cleaning is required. More often than not, component standoff heights are in the range of 1 to 2 mils. From a cleaning perspective, as the space under components shrinks, the smaller space is more likely to be completely filled by flux residue. Looking at the evolutionary path, we have transitioned from flux being around the component (through-hole and SMT outline packs), to flux moving under components (SMT arrays); to completely filling flux under tightly spaced components (0204s and flip chips).
Considering a spray-in-air water-based cleaning process, cleaning effectiveness or total cleaning energy is a combination of chemical energy (the solvency of the cleaning agent), mechanical energy (spray bar, nozzle design and pump pressure) and thermal energy (temperature of the cleaning agent). In combination, cleaning energy begins to soften the flux-laden surfaces, thereby enabling the creation of fluid flow channels under the component.1 Undercomponent flux removal is characterized by three steps:
- Soften the outer solvent-depleted shell and flux matrix.
- Fluid jets with sufficient energy create flow channels within the flux matrix.
- Bulk flux residue is completely eroded by flow channels.
Additionally, physical forces impact the ability of fluid flow within tight crevices. To understand the effect of these forces, one must understand the interaction of cohesive and adhesive forces between a liquid and a solid, surface tension and capillary action. In combination, these forces enable liquids to more easily penetrate narrow spaces or gaps.
In brief, cohesive forces are the forces that hold water molecules together and create surface tension, and adhesive forces are the forces that cause water to spread across solid surfaces. The interaction between cohesive forces and adhesive forces causes capillary action.1 Given the low surface tension of the cleaning agents, coupled with capillary action, the cleaning solution is drawn under the low-standoff components, creating the flow channels, and begins to solubilize the flux residue.
Liquids with lower surface tension tend to have better wettability; that is, the ability to spread across the surface of a solid. A common way to measure wettability is to assess the contact angle. The contact angle is defined as the angle formed by the intersection of the liquid-solid interface and the liquid-vapor interface (geometrically acquired by applying a tangent line from the contact point along the liquid-vapor interface in the droplet profile).2 A smaller contact angle is observed when the liquid spreads on the surface, while a large contact angle is observed when the liquid beads on the surface. To exemplify this point, the contact angle of fresh wash solution used for this study and of pure DI water were measured on the test vehicle surface (FR-4). The measured angles were 11.33° and 65.86° for the wash solution and DI water, respectively (FIGURES 1 and 2).
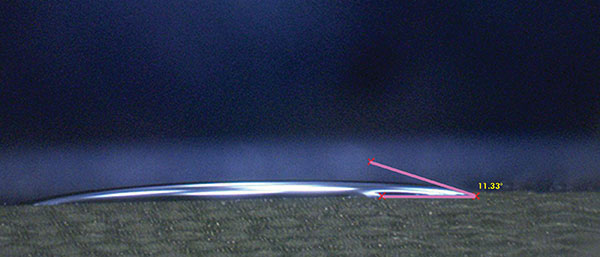
Figure 1. Contact angle fresh wash solution.
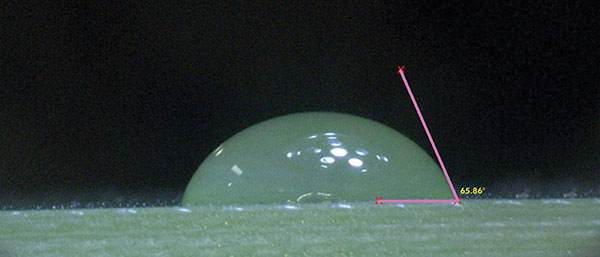
Figure 2. Contact angle DI water.
Through field experience with numerous PCB defluxing applications, it is known that water-based cleaning agents with low surface tension can penetrate low-standoff components as described.3 Likewise, it is known these processes include effective rinsing, as confirmed by the analytical analyses such as ion chromatography (IC) and undercomponent visual inspection conducted by the customers. So, how can DI water with an average surface tension of 70 dynes/cm penetrate under low-standoff components and effectively rinse out the flux-laden wash solution?
This study was designed to gain an understanding of the dynamics of the rinse process. Based on numerous customer field trials and their knowledge of the spray-in-air cleaning process, the authors theorized that as DI water contacted the substrate surface, it mixed with residual cleaning solution around the component. This results in reducing the rinse water surface tension. Given the mechanical energy of the pump system and through capillary action, the rinse water is able to penetrate the low-standoff component gap and effectively rinse the remaining wash solution.
Two hypotheses were proposed:
H1: Wash solution that is not completely rinsed from undercomponents will contain ionic contamination.
H2: The combination of mechanical energy and residual wash solution left underneath low-standoff components can overcome DI water high surface tension, enabling the DI water to penetrate underneath the components and rinse the wash solution.
Methodology
The purpose of the study was to assess the effectiveness of low-standoff under-component rinsing at standoff heights of 1, 2, 3 and 5 mils. The Zestron test vehicle chosen for the substrate included pads for numerous chip cap components (6032, 1825, 1812, SOT-23, 1206 and 1210), as well as BGA and QFP components. The board was not assembled with dummy components, for it would be difficult to maintain the desired standoff height. Since the focus of the study was to assess the ability of DI water to penetrate and rinse under low-standoff components, four areas or quadrants of the test vehicle were covered with glass slides. The final result yielded slides covering the BGA and QFP areas that measured 1.5" x 1.5" (2.25 in2) and slides covering the chip cap component area measuring 1.5" x 1.25" (1.875 in2). These were then shimmed to the desired standoff heights and adhered to the substrate with adhesive. Given the surface area of the slides, this greatly enhanced the rinsing challenge (FIGURES 3 and 4).
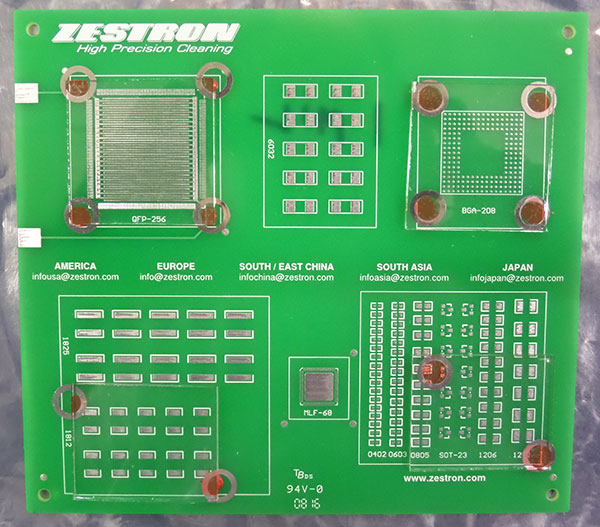
Figure 3. Substrate with glass slides.
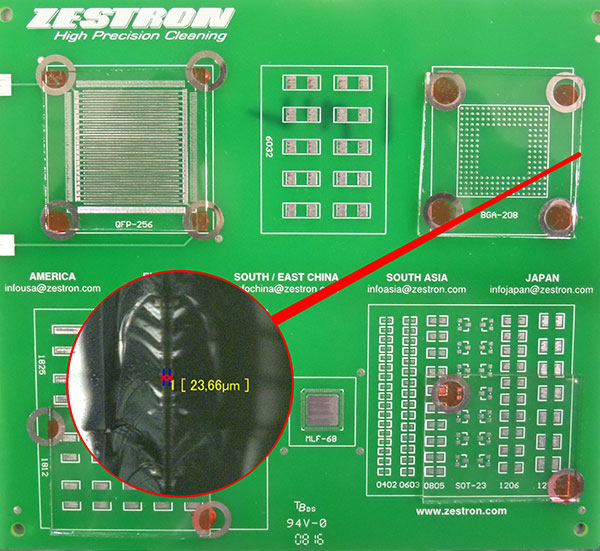
Figure 4. Glass slide with 1 mil standoff.
Substrate preparation. Initially, the authors planned to screen WS solder paste (without components) on the desired pads and cover the quadrants with the glass slides at the required standoff heights and reflow. Upon doing so, the authors found that not all the paste was completely reflowed; sporadic bridging occurred, and the desired standoff heights were not maintained as a result of the reflow process. As an alternate approach, the authors screened the paste, reflowed the boards and then attempted to add the glass slides. In this case, reflow was satisfactory; however, once again the desired standoff heights could not be maintained.
For this study, the most critical variable to control in order to understand rinse effectiveness was maintaining consistent standoff heights. Given the issues with the solder paste, the authors decided to forego using solder paste and directly cover the substrate quadrants with the glass slides. The slides could be shimmed to the desired standoff height and easily adhered with the adhesive.
The cleaning agent selected for the study was a dynamic surfactant. As this product is highly inhibited, it is more difficult to rinse due to the thick film of inhibitor remaining on the substrate surface from the wash process, thereby presenting a greater challenge to the rinsing process.
Wash protocol. As solder paste was not used, the substrates did not require cleaning. However, wash solution had to be trapped under the glass slides in order to conduct the rinse study. To accomplish this, wash solution was injected under the glass slides with a needle completely filling the void space (FIGURE 5).
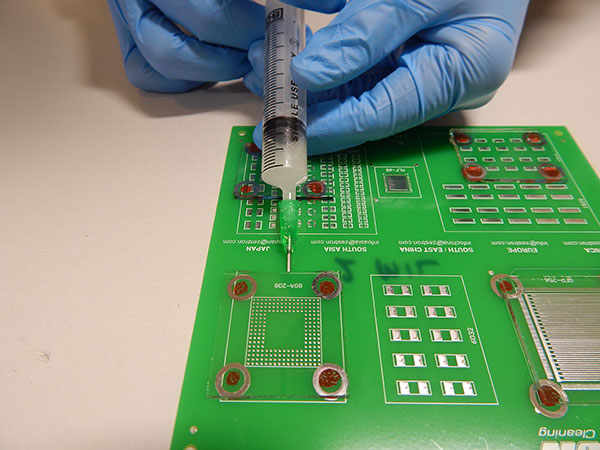
Figure 5. Wash solution injection.
To fully understand the impact of rinsing wash solution, the authors assessed rinsing the substrates with the glass slide cavity filled with fresh or uncontaminated wash solution, as well as flux-loaded wash solution. Flux-loaded wash solution is more viscous and thus will be more difficult to rinse. NVR (nonvolatile residues) is an indication of contamination.4 For the fresh wash solution, the average NVR value was 1.32%. This amount is largely due to the high amount of inhibitors included in the cleaning agent formulation. For the flux-loaded wash solution, the average NVR was 10.66%. This is very high because, in general, as NVR approaches 8% or so, the wash bath is deemed to be fully loaded, therefore requiring replacement. Thus, this level of NVR represents a worst-case scenario for determining rinse effectiveness.
Rinse protocol. For the rinsing trials, two scenarios were considered. The first was a partial rinse, and the second a dynamic rinse using the spray-in-air equipment. For the partial rinse, DI water was squirted on the substrate using a safety wash bottle for approximately one minute. This was incorporated to assess the effectiveness of rinsing without mechanical energy.
Batch and inline spray-in-air cleaning equipment was employed for the dynamic rinse trials. In this case, the test vehicles were not exposed to the wash process within the cleaning equipment. The rinse operating parameters for each machine were based on typical parameters commonly used and are detailed in TABLES 1 and 2.
Table 1. Inline Cleaner Operating Parameters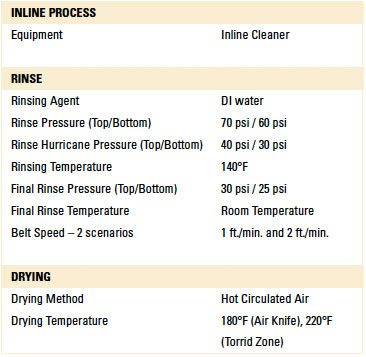
Table 2. Batch Cleaner Operating Parameters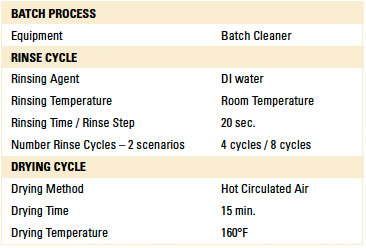
For all inline trials, the wash pump was left inoperable. For all batch trials, only the rinse and dry cycles were used. Following the dry cycle from either cleaner, it was expected that all substrates should be free of wet spots under the glass slides. However, if residual water is present, it should be free of ionics to ensure reliability.
Cleanliness assessment. For cleanliness assessment, or rather rinse effectiveness evaluation, four methodologies were used (TABLE 3).
Table 3. Cleanliness Assessment Methodologies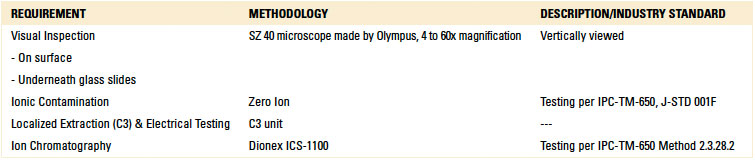
Localized extraction (C3 test technique) was used to create the eluent for ion chromatography analysis. It is noted that C3 incorporates an electrical test developed by the manufacturer that correlates leakage current over time with corrosive residues. Based on standards developed by the manufacturer, test results can classify the test area as “clean” or “dirty.”5 Although the electrical test is not an IPC standard, this result was also noted and reported.
Prior to proceeding with the trials, substrates were prepared to conduct baseline tests for each cleanliness assessment methodology. This was performed to confirm if each analytical test method identified is able to detect wash solution residues. These tests were conducted on the 1 mil space substrates only as this would represent the worst-case scenario.
Main Research
Inline and batch spray-in-air equipment was employed for dynamic rinsing. For the inline cleaner, belt speeds of 1 and 2 ft./min. were used, and the rinse water temperature was 140°F. For the batch cleaner, both four and eight rinse cycle scenarios were used with the rinse water at room temperature. These parameters are typical field settings for the selected cleaning equipment.
In total, eight rinse trials were conducted. For each trial, four test vehicles were prepared, one for each standoff height (1, 2, 3 and 5 mil). Thus, 32 substrates were prepared, with 16 used for inline and batch, respectively (TABLE 4).
Table 4. Rinse Trials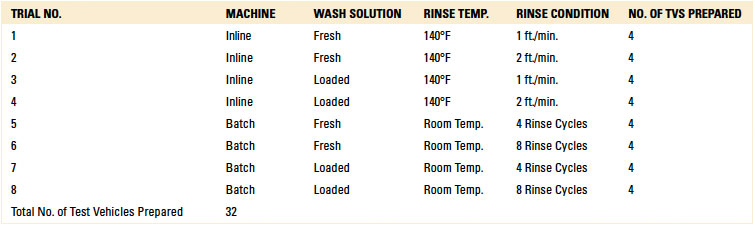
Baseline analytical testing. Additional boards with 1 mil spacing were prepared for baseline analytical assessment to confirm the selected analytical techniques could detect wash solution residues. Three substrates were required for ionic contamination analysis and five were required for C3 and IC analysis. For the baseline dynamic rinsing trial, only the inline cleaner was used.
For the ionic contamination analysis, three (3) trials were conducted. These were:
- Trial 1 – 1 mil board without wash solution, rinsed in inline cleaner at 1 ft./min.
- Trial 2 – 1 mil board injected with fresh wash solution, no rinsing.
- Trial 3 – 1 mil board injected with fresh wash solution, partial rinsing.
To assess total ionic contamination, the authors considered total board contamination. The standard limit based on IPC-TM-650 is 10.06µg/in2. However, this value is based on a substrate with soldered components exposed to a cleaning process. For this study, as the substrates were bare boards, the authors chose 4.7µg/in2, a reduced value for maximum contamination. Based on the substrate surface area of 63 in2, the authors established pass/fail limit at 300µg (4.7µg/in2 x 63 in2).
The C3 extraction was completed on two areas of the substrate, one on the perimeter of the glass slide (A1) and another on a bare pad without a glass slide (A2) (FIGURES 6 and 7).
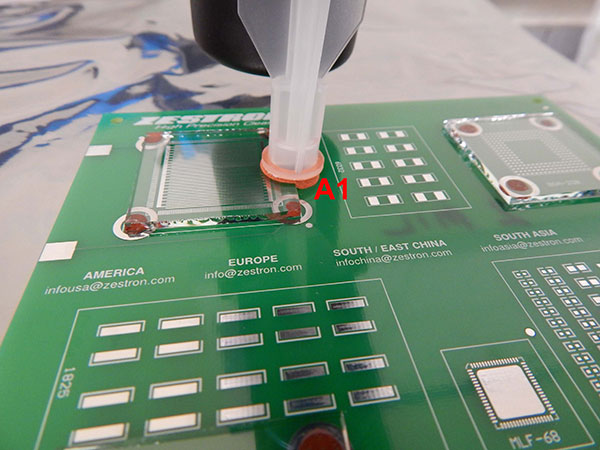
Figure 6. C3 extraction Area A1.
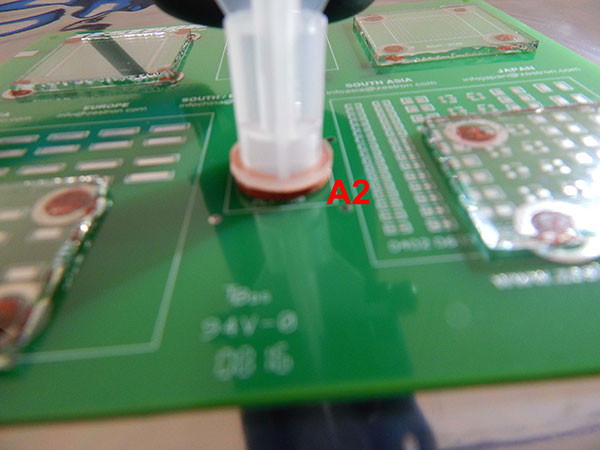
Figure 7. C3 extraction area A2.
For the C3 electrical analysis, five trials were conducted. These were:
- Trial 4 – 1 mil board without wash solution, rinsed in inline cleaner at 1 ft./min.; test location A1.
- Trial 5 – 1 mil board injected with fresh wash solution, no rinsing; test location A1.
- Trial 6 – 1 mil board injected with fresh wash solution, partial rinsing; test location A1.
- Trial 7 – Dried fresh wash solution; test location A2.
- Trial 8 – Dried loaded wash solution; test location A2.
For trials 7 and 8, wash solution was not injected under the glass slide. Rather, fresh and loaded wash solution was dripped on the bare pad on the test board, and then dried in a standalone oven for 1 hr. at 212°F (100°C). Dried-loaded wash solution is ionic in nature. Thus, the purpose of the test was to determine if the C3 electrical test and subsequent IC test of the extracted solution could detect surface ionics.
Minitab analysis. Numerous key variables were considered within this study. For the inline trials, these include belt speed, standoff height and wash solution loading. For the batch cleaner, these include number of rinse cycles, standoff height and wash solution loading.
All variables were plotted and analyzed using Minitab software for main effects and interaction plots.
Results
Baseline analytical assessment. Prior to proceeding with the dynamic rinsing trials, baseline analytical tests were performed on 1 mil standoff substrates to confirm test efficacy.
Three scenarios were considered for this analysis. Using the inline cleaner operating at a belt speed of 1 ft./min., two substrates underwent dynamic cleaning, one substrate with no wash solution within the gap and the other with fresh wash solution within the gap. The third substrate was not rinsed, but the gap was filled with fresh wash solution.
The authors used 4.7µg/in2 or a total of 300µg as the maximum value for “clean” assessment. As evidenced through these tests, IC analysis can detect ionics of fresh cleaning agent (Trials 2 and 3). Thus, IC testing is deemed valid for further analysis.
C3 electrical test. Five substrates were prepared for this analysis. For Trials 4, 5 and 6, the substrates were prepared exactly as they were for IC analysis. For Trials 7 and 8, the test was conducted with the dried fresh and loaded wash solution on the bare pad on test board.
The C3 electrical test produced a failing result for Trial 5, indicating that ionics can be detected from fresh wash solution. However, the electrical test yielded a “clean” result when testing dried fresh or loaded wash solution.
Localized extraction (IC). As part of the C3 analysis with Trials 4 through 8, eluent was developed through localized extraction and used for IC analysis (TABLE 7).
Table 7. Ion Chromatography – Localized Extraction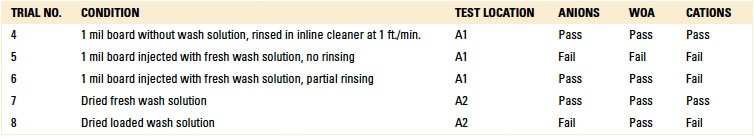
Trials 4 and 7 produced passing results. For Trial 7, whereby the substrate had dried wash solution on the surface, one would expect a failed result. The authors theorized one possible explanation for the passing result. As this scenario included fresh wash solution, which likely contained a smaller volume of ionics compared to loaded wash solution, the ionics evaporated during the drying process to an undetectable level. For Trial 8, however, the substrate was prepared with loaded wash solution, likely with a greater volume of ionics. In this case, IC could detect the ionics, thereby producing a failed result, even though the substrate was oven dried.
However, Trials 5 and 6 yielded “failed” results. This was expected, as these trials were evaluated with fresh wash solution that was either not rinsed or partially rinsed. Based on the results, IC testing was deemed valid for further analysis.
In conclusion, baseline analytical assessment confirmed that IC analysis and localized IC analysis are valid tests to assess ionic residues resulting from incomplete or a partial rinsing process.
Visual Inspection Results
Following baseline analysis, 32 substrates were prepared and rinsed in the batch and inline cleaning equipment, as detailed in Table 4. All substrates were visually inspected for wet spots and each identified as:
- Clean – no visible water.
- Minor wet spots.
- Very minor wet spots.
Visual inspection result details are in the Appendix (TABLES 8 and 9). FIGURES 8 and 9 are representative pictures of the visual inspection results.
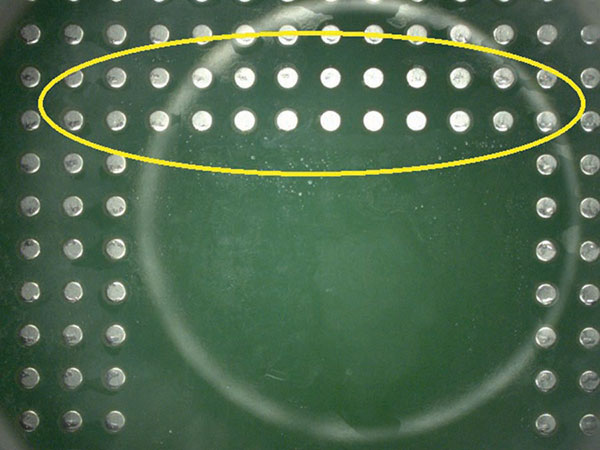
Figure 8. Minor wet spots.
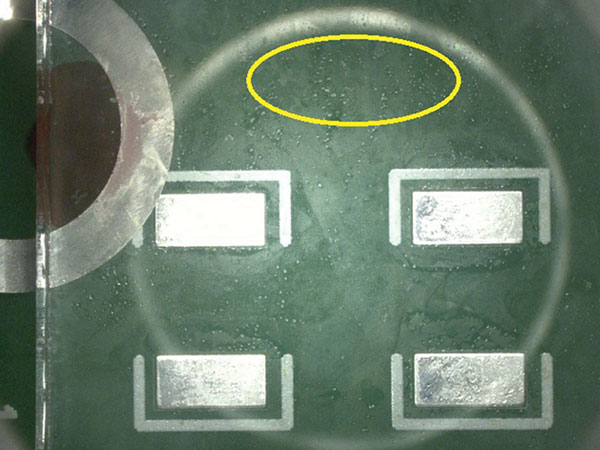
Figure 9. Very minor wet spots.
Ionic contamination. Ionic contamination analysis for both the inline and batch trials for all standoff heights yielded passing results (reference appendix for details, TABLES 10 and 11). Baseline testing confirmed that ionic contamination analysis can detect ionics if present. For all trials conducted using the batch and inline cleaners, rinsing was sufficient such that ionic contamination analysis yielded passing results.
C3 electrical testing. C3 electrical testing yielded passing results for both the inline and batch trials for all standoff heights (reference appendix for details, TABLES 12 and 13).
As indicated by Trial 5 in the baseline testing, C3 can identify ionics from fresh wash solution on a substrate that was not rinsed. Thus, rinsing in both the batch and inline cleaners was sufficient such that C3 electrical testing yielded passing results.
Localized extraction (IC). For the inline trials, IC analysis yielded passing results for all standoff heights with fresh wash solution. However, three failed results were noted with the loaded wash solution. Two failures occurred with the 1 mil gap substrates at belt speeds of 1 ft./min. and 2 ft./min. The third failure occurred with the 3 mil gap substrate at 2 ft./min. Given the passing results with loaded wash solution for the 2, 3 and 5 mil standoff substrates at 1 ft./min., thorough rinsing is achievable. However, optimization with rinse manifold configuration and process is required.
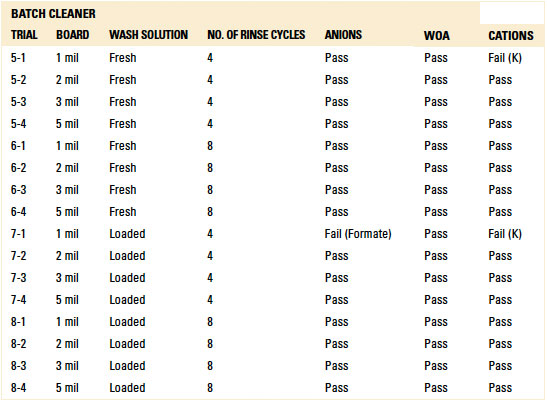
For the batch trials, other than the 1 mil standoff with four (4) rinse cycles with either the fresh or loaded wash solution, IC analysis yielded passing results for all standoff heights at both four and eight rinse cycles. Given the results with the fresh and loaded wash solutions, thorough rinsing is achievable. However, the number of rinse cycles is critical for rinse effectiveness and can be optimized for the given process (reference appendix for details, TABLES 1 and 15).
Minitab. Ionic contamination values were plotted and analyzed using Minitab. Inline cleaner main effects and interaction plots for underneath rinsability are shown in FIGURES 10 and 11.
- Standoff height is the most significant factor that determines rinsability of wash solution underneath low standoff areas.
- In general, fresh wash solution and slower belt speed yielded improved rinsability.
- Standoff height is not critical for rinsing fresh wash solution underneath low standoff areas; however, it is critical for rinsing loaded wash solution.
- Slower belt speed significantly improves rinsability underneath 1 mil standoff height.
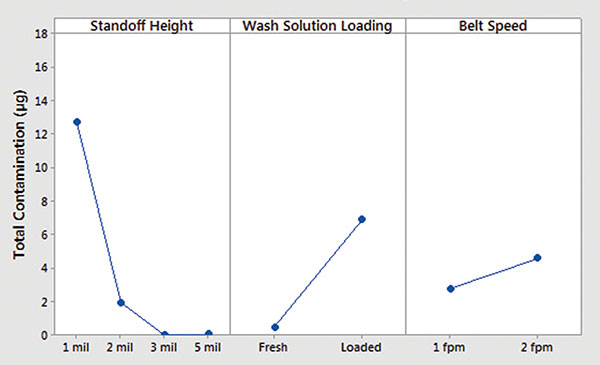
Figure 10. Inline cleaner analysis – main effect plot.
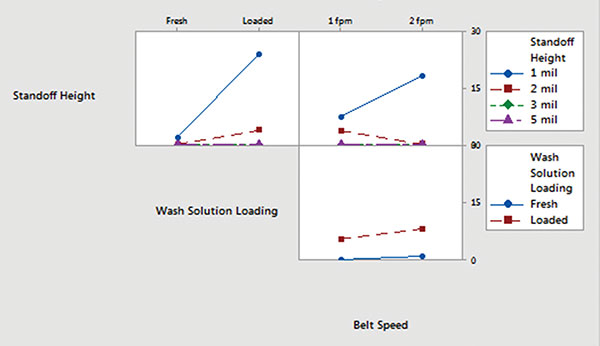
Figure 11. Inline cleaner analysis – interaction plot.
Batch cleaner main effects and interaction plots for underneath rinsability are detailed in FIGURES 12 and 13.
- Standoff height is the most significant factor that determines rinsability of wash solution underneath low standoff areas.
- In general, fresh wash solution and more rinse cycles yielded improved rinsability.
- Standoff height is not critical for rinsing fresh wash solution underneath low standoff areas; however, it is critical for rinsing loaded wash solution.
- More rinse cycles significantly improve rinsability underneath 1 mil standoff height.
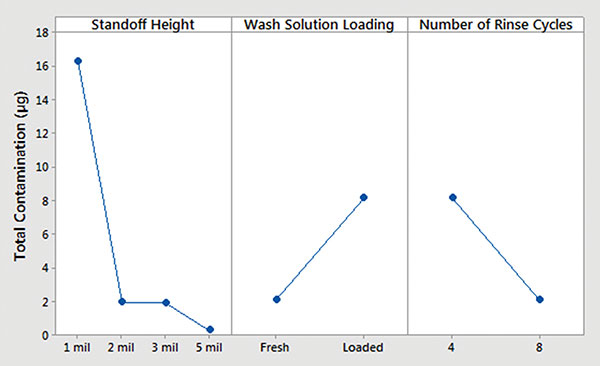
Figure 12. Batch cleaner analysis – main effects plot.
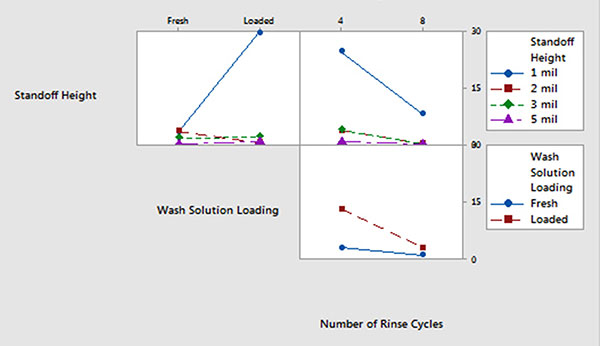
Figure 13. Batch cleaner analysis – interaction plot.
Conclusions
Through this study, the authors confirmed that DI water can effectively rinse wash solution underneath low standoff areas with spray-in-air inline and batch cleaning processes. The surface tension of the rinse water can be reduced through contact with residual wash solution and, through the mechanical energy developed by the rinse process, penetrate and rinse the wash solution from under low-standoff components at standoff heights as low as 1 mil.
Furthermore, this study confirmed that ionic contamination and ion chromatography (localized extraction) analyses are valid methodologies for assessing rinse effectiveness, confirmed through baseline Trials 2, 3, 5 and 6 and results detailed in Tables 10, 11, 14 and 15. The majority of aqueous-based cleaning agents contain ionic constituents. Thus, if wash solution is not completely rinsed, these ionic constituents can be detected.
As one would expect, the study confirmed that as wash solution becomes flux loaded (as measured by NVR), and standoff height decreases (less than 1 mil), rinsing becomes more difficult. This is evident from the Minitab results (Figures 11 and 13). Even so, both the batch and inline cleaners can effectively rinse under low-standoff components when optimized. Using the ionic contamination and ion chromatography cleanliness assessment methodologies, the rinse processes can be optimized as required.
The test results presented as a result of ionic contamination and ion chromatography analyses confirmed the Hypotheses H1 and H2 are indeed true.
Overall Conclusion
This study presented challenging scenarios to assess the rinsability question. Glass slides were used representing low-standoff components; however, the undercomponent’s surface area of the glass slides was large, similar to that of QFPs and BGAs. Given the large surface area, thorough undercomponent rinsing was achieved. Although smaller undercomponent surface areas were not considered in this study, they should prove less challenging to achieve complete rinsing.
Although this study did not consider rinsing substrates with soldered components for the reasons stated in the Methodology, the authors theorized that components that trap a large amount of wash solution, such as vented BGAs, open sockets and components having cavities and capacitor sleeves, could be more challenging to rinse completely. For substrates including these types of components, and cleaned-in aqueous-based batch and inline cleaning processes, rinse optimization, including additional rinse time and/or mechanical energy (more spray bars in rinse section of inline cleaners) will be required.
In cases where a board has some fresh wash solution (partial or incomplete rinsing) but it is completely dried, the remaining wash solution may not be corrosive and will not cause failure. But this may not be applicable for all cleaning agents. Some cleaning agents do not dry residue-free, and remaining residue could be ionic.
Dried loaded wash solution is ionic in nature. If dried loaded wash solution is left on the board, it can cause failure. Therefore, effective rinsing is a critical part of the cleaning process.
References
1. H. Wack, U.Tosun, N. Ravindran and S. Chamousset, “Fluid Flow Mechanics: Key To Low Standoff Cleaning,” IPC Apex, March 2008.
2. JRank Science & Philosophy, Capillary Action – Liquid, Force, Water, and Surface, retrieved from http://science.jrank.org/pages/1182/Capillary-Action.html.
3. Y. Yuan and T. Randall Lee, “Contact Angle and Wetting Properties,” Surface Science Techniques, Springer Series in Surface Sciences, 2013.
4. U. Tosun, A. Vargas and B. Kim, Pressure Products, “Concentration Monitoring Closed Loop Control – Phase 2,” IPC Apex Expo, March 2014.
5. S. Shoda and T. Munson, “Cleanliness Assessment Correlation to Electronic Hardware Reliability,” IPC Apex, March 2007.
Ed.: This article was originally published in the proceedings of SMTA International, September 2016, and is reprinted here with permission of the authors.
, M.S.Ch.E. is application technology manager and , M.S.Ch.E. is senior application engineer at Zestron Americas (zestronusa.com); u.tosun@zestronusa.com.
Table 5. Ionic Contamination Test Results
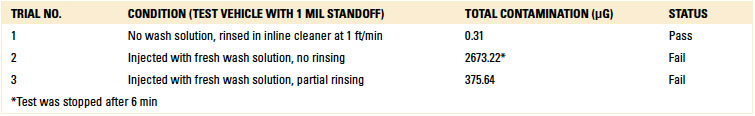
Table 6. C3 Electrical Test Results
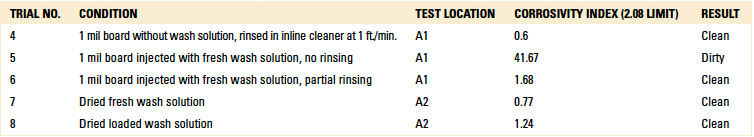
Table 8. Results – Visual Inspection Inline Cleaner
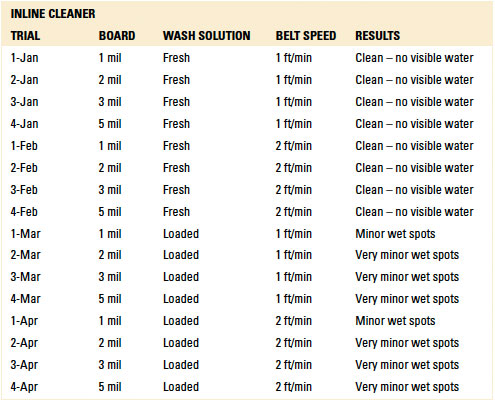
Table 9. Results – Visual Inspection Batch Cleaner
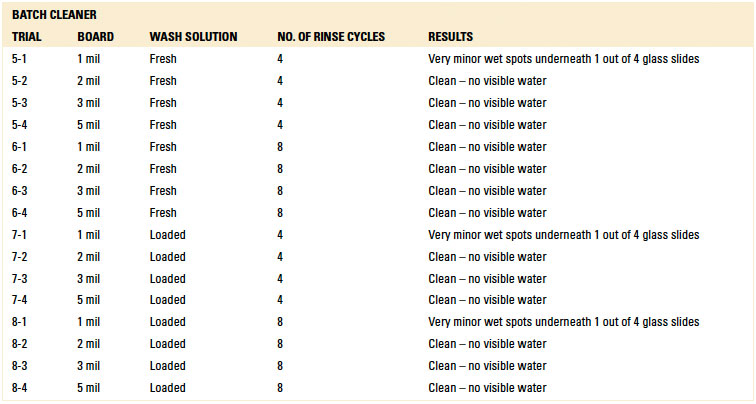
Table 10. Results – Ionic Contamination
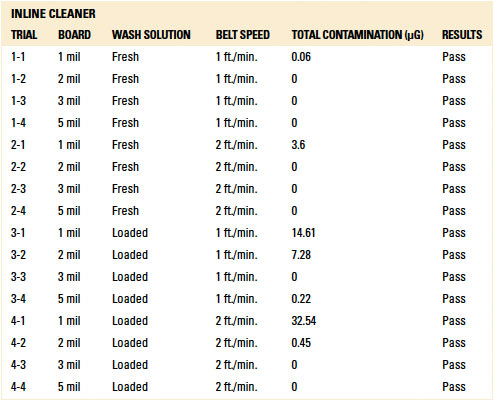
Table 11. Results – Ionic Contamination Batch Cleaner
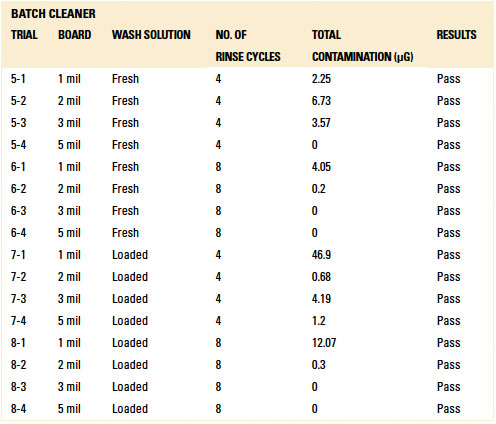
Table 12. Results - C3 Electrical Tests Inline Cleaner
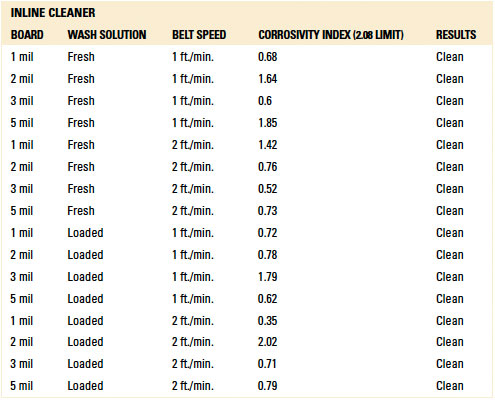
Table 13. Results - C3 Electrical Tests Batch Cleaner
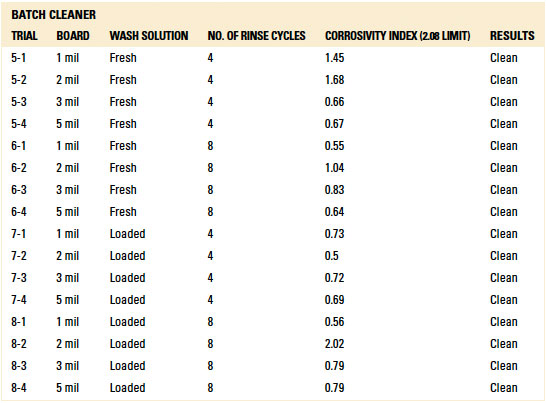
Table 14. Results - Ion Chromatography Localized Extraction Inline Cleaner
(Raw data available upon request)
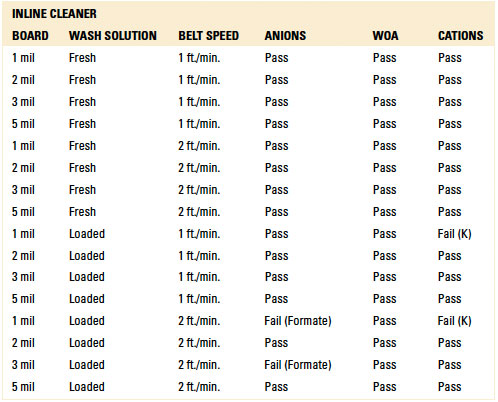
Table 15. Results - Ion Chromatography localized Extraction Batch Cleaner
(Raw data available upon request)
Register now for PCB West the Silicon Valley's largest PCB industry trade show: pcbwest.com! Now with full-day electronics assembly tutorials!


